Download
1 / 31
310 likes | 424 Views
Transaction Costs of Carbon Sink Projects. Oscar Cacho School of Economics University of New England AUSTRALIA. www.une.edu.au/febl/Econ/carbon/. Outline. Background Overview of abatement and transaction costs Reducing transaction costs A model to analyze the effect of project design

E N D
Transaction Costs of Carbon Sink Projects Oscar Cacho School of Economics University of New England AUSTRALIA www.une.edu.au/febl/Econ/carbon/ FAO 2005 Seminar, O. Cacho
Outline • Background • Overview of abatement and transaction costs • Reducing transaction costs • A model to analyze the effect of project design • The measurement problem • Conclusions FAO 2005 Seminar, O. Cacho
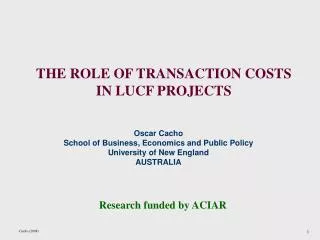
Background Clean Development Mechanism (CDM) allows Kyoto signatories to reduce greenhouse gas emissions in developing countries (Article 12). CDM projects can operate in the energy sector (reduced emissions) or in the land-use change and forestry (LUCF) sector (sinks). Afforestation and reforestation projects are eligible within the LUCF sector. FAO 2005 Seminar, O. Cacho
Submitting and approving CDM proposals Project design project developer host government National approval project developer Submit Project Design Document Stakeholder comments Validation operational entity Registration CDM executive board Verification and certification operational entity CDM executive board CER issuance FAO 2005 Seminar, O. Cacho
Transaction Costs cost of participating in the CER market (CT). SA P($) CT SP PA PP D QA QP Q(CERs) Abatement Costs opportunity cost of land-use change (SP). FAO 2005 Seminar, O. Cacho
Buyer pays TC Seller pays TC C2 C1 C1 a a Buyer cost ($/Mg) b b c Emission offsets (Mg/ha) c TC TC Carbon price ($/Mg CO2) Carbon price ($/Mg CO2) Buyer Seller FAO 2005 Seminar, O. Cacho
Managing C stocks Gliricidia in Jambi, Indonesia initial soil carbon low medium high high carbon stock (Mg/ha) firewood harvest medium low years FAO 2005 Seminar, O. Cacho
Biomass C in Indonesian systems FAO 2005 Seminar, O. Cacho
Abatement Costs Modeling results for Sumatra, Indonesia (degraded land) FAO 2005 Seminar, O. Cacho
Reduce by: • generating and disseminating information; • allowing simplified baselines for smallholder projects. Transaction costs • find site and group of landholders; • survey alternative land uses; • gather biophysical, social and economic information about the site; • establish relationships with the locals. • search • negotiation • approval • administration • monitoring • enforcement • insurance FAO 2005 Seminar, O. Cacho
Reduce by: • working through farmer groups and local NGOs. Transaction costs • search • negotiation • approval • administration • monitoring • enforcement • insurance • agree on required land uses; • assign responsibilities to parties; • agree on monitoring and payment schedule. FAO 2005 Seminar, O. Cacho
Reduce by: • CDM Executive Board simplifying validation process. Transaction costs • search • negotiation • approval • administration • monitoring • enforcement • insurance • cost of delays after submission of Project Design Document; • cost of project validation. FAO 2005 Seminar, O. Cacho
will decrease as countries and market participants gain experience; • appropriate IT infrastructure is important. Transaction costs • search • negotiation • approval • administration • monitoring • enforcement • insurance • keeping records of project participants; • administering payments and dealing with problems and disagreements; • may require establishment of a local project office. FAO 2005 Seminar, O. Cacho
Reduce by: • sampling C stocks at longer intervals; • using remote-sensing technology; • involving landholders in sampling C stocks. Transaction costs • search • negotiation • approval • administration • monitoring • enforcement • insurance • measuring C sequestration actually achieved; • certification and verification by Designated operational Entity (DOE). FAO 2005 Seminar, O. Cacho
Reduce by: • providing smallholders with credible prospects and sufficient incentives to prevent abandonment of the project; • involving farmer groups and promoting monitoring within the community. Transaction costs • search • negotiation • approval • administration • monitoring • enforcement • insurance • ensuring compliance with the terms of the project; • may include litigation. FAO 2005 Seminar, O. Cacho
Reduce by: • deducting a risk premium from the price paid for C sequestration; • diversification of project portfolio (spatial arrangement and project types); • keeping a buffer of C stocks that is not converted to CERs. Transaction costs • search • negotiation • approval • administration • monitoring • enforcement • insurance • no formal insurance for sink projects is available yet. FAO 2005 Seminar, O. Cacho
Reducing transaction costs • Generate and disseminate information (LUCF systems, baselines). • Bundle projects. • Teach smallholders to measure carbon. • Encourage community self-regulation. • Bundle payments for other environmental services. • Promote secure land tenure. FAO 2005 Seminar, O. Cacho
Sampling Intensity and CERs FAO 2005 Seminar, O. Cacho
Synergies * relative to natural forest Data from Murdiyarso et al. for Indonesia FAO 2005 Seminar, O. Cacho
For buyer: if seller defaults, the cost of buying C offsets elsewhere (market price of CERs) + transaction costs already incurred. • For seller: if buyer defaults, the cost of converting back to preferred land use + establishment and learning costs already incurred. Model of contractual arrangements Transaction margin = Revenue – Governance Costs Governance costs CT transaction costs CA associated transformation costs (= 0) CL cost of loss due to transaction failure Based on Dorward (2001) FAO 2005 Seminar, O. Cacho
The seller’s problem CG(s) RG(s) Governance costs and returns acceptable to seller free market vertical Contractual form FAO 2005 Seminar, O. Cacho
CG(b) Governance costs and returns RG(b) acceptable to buyer free market vertical Contractual form The buyer’s problem FAO 2005 Seminar, O. Cacho
CG(s) RG(s) CG(b) Governance costs and returns RG(b) acceptable to both free market vertical Contractual form Feasible solutions based on Dorward (2001) FAO 2005 Seminar, O. Cacho
(A) Free Market (B) Individual Farmer Contract (C) Community Contract (D) Vertical Integration farmers and C brokers trade in free (local) market, brokers then sell C offsets in international market. private entity establishes individual contracts with farmers to undertake certain land-use practices. NGO establishes a program through farmer groups (farmer-group leaders play a critical role). firm purchases land, establishes commercial plantations and sells C offsets in the international market (provides employment). Contractual forms FAO 2005 Seminar, O. Cacho
Agents • Seller (farmers): • Buyer (NGO / government / private entity): Sell C offsets at farm price PF Buys C offsets from sellers at PF and sells them in the CER market at net price PB = PCER – CB PF price obtained by seller per Mg C PB net price obtained by buyer per Mg C PCER price of C in the CER market ($/Mg) CB brokerage costs per Mg C sold in CER market FAO 2005 Seminar, O. Cacho
buyer’s expected utility profit to buyer probability (to buyer) of seller behaviour j proportion of C offsets under contractual arrangement k The buyer’s problem k = contractual arrangements (1,…,K) i = market conditions (1,…,I) m = environmental conditions (1,…,M) j = agent behaviour (comply, default) FAO 2005 Seminar, O. Cacho
net C market price farm price transaction costs cost of failure The buyer’s problem k = contractual arrangements (1,…,K) i = market conditions (1,…,I) m = environmental conditions (1,…,M) j = agent behaviour (comply, default) FAO 2005 Seminar, O. Cacho
seller’s expected utility profit to seller probability (to seller) of buyer behaviour j proportion of C offsets under contractual arrangement k The seller’s problem k = contractual arrangements (1,…,K) i = market conditions (1,…,I) m = environmental conditions (1,…,M) j = agent behaviour (comply, default) FAO 2005 Seminar, O. Cacho
The seller’s problem farm price opportunity cost transaction costs cost of failure k = contractual arrangements (1,…,K) i = market conditions (1,…,I) m = environmental conditions (1,…,M) j = agent behaviour (comply, default) FAO 2005 Seminar, O. Cacho
The measurement problem for each contractual arrangement (k), agent behaviour (j), market condition (i) and environmental condition (m), estimate: B ,S probability of agent behaviour (CT)B,Stransaction costs (for buyer and seller) (CL)B,S losses due to transaction failure (for buyer and seller) OS opportunity cost of land-use change to seller PB price of C to buyer Optimizing contract design Max: FAO 2005 Seminar, O. Cacho
Conclusions • Transaction costs are largely related to obtaining and processing information. • Designing efficient projects requires a good understanding of the abatement costs and transaction costs involved. • Next step: flesh out model to allow consistent measurement and to help reduce transaction costs. FAO 2005 Seminar, O. Cacho