Download

1 / 17
180 likes | 319 Views
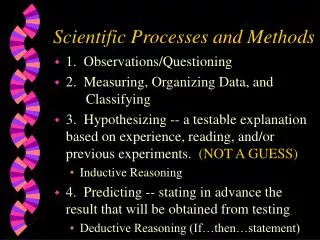
SCIENTIFIC PROCESSES. S CIENTIFIC PROCESSES. 1 . Observation - noting down daily occurrences in nature ; and directly received by t he senses. Kinds: a.Q uantitative - numerical (how many and how much) ex amples : Typhoon Isang was the 9 th typhoon

E N D
SCIENTIFIC PROCESSES 1. Observation- noting downdailyoccurrences in nature ; and directly received by the senses. Kinds: a.Quantitative- numerical (how many and how much) examples: Typhoon Isang was the 9th typhoon that hit the Philippines. Typhoon Isang has a wind speed of 90 kph.
b. Qualitative- descriptive (what) Examples: • The clouds are dark and heavy. • The plants have yellow and falling leaves after the typhoon.
*Observation A fact learned directly from the senses. • Sight • Smell • Touch • Hearing • Taste • Observations are not • an inference (“I think”), • A question (???), • or evidence (“the data supports”)
Quantitative and Qualitative observations. • Quantitative—observations involving measurements such as length, mass, or volume. (quantity= how much? Numbers) • Qualitative—observations of properties such as texture, shape, or color (comparing to known). (quality= what’s it like?
Observations • Qualitative – describe with words • Hot , red, large • Quantitative – describe with numbers • 100° , 10 meters, 3.46 grams • Scientists prefer quantitative • Easy to agree upon • No personal bias
When observing, always: • Write the time and date of the observation • Record observations at the time they were made; • Make both quantitative and qualitative observations.
2. Inference (Interpretation) - explanation of the observation Examples: a. O – The mango is soft, awful, watery, black, andwith 10 maggots. I – The mango is rotten. b. O – The fruit is round and small. I – The fruit is cherry. I – The fruit is lychee.
c. O – The clouds in the sky are dark and heavy. I – The clouds will bring rain. 3. Prediction – forecasting anevent Kinds: a. interpolation (within the observed data) b. extrapolation (beyond the observeddata)
safe prediction is based on pattern/regularity. Example:O – The heavy rains pours persistently. Prediction – Classes will be suspended during the day.
4. Variables – factors that are tested and affect the result of the experiment. Kinds: a. Constant –kept the same in all trials, not changed; b. Manipulated(independent variable)– changed/varied; c. Responding(dependent variable)– effect of the manipulated variable • There must be only one MV at a time.
Example: a)An egg was tested if it will float in the water with 5 tbsp of salt. CV- egg, water; MV – salt RV – egg floats b)Two inflated balloons were exposed to sunlight to describe the movement of molecules when they are heated. • CV – balloons; MV- sunlight RV – moving molecules
Identify the variables in the given sample experiment. Data 1
Data 2An experiment has been conducted on the effects of ground ipil-ipil seeds on the rate of growth of tilapia. The fish were fed by increasing amounts of ipil-ipil seeds for one month. Below is the result of the experiment.
Questions: a. Based on the given data, a. What will happen to the earth with the given amount of CO2 concentration in the atmosphere? What is your prediction? b. In 2020, what do you think is the amount of CO2 concentration in the atmosphere?
c. What are the variables in the experiment (data 2)? • CV – • MV – • RV – d. Why do we need to have only one manipulated variable at a time?