Download
1 / 17
170 likes | 235 Views
Leasing to European SMEs. ALB | November 2012. Tanguy van de Werve Leaseurope Director General. Global Equipment Leasing Markets in 2011. Canada CFLA 27 bil€. Japan JLA 41 bil€. 11%. Leaseurope 232 bil€. 16%. US ELFA 154 bil€. China CLBA 106 bil€. 1%. 13%. 100%.

E N D
Leasing toEuropeanSMEs ALB |November 2012 Tanguy van de WerveLeaseurope Director General
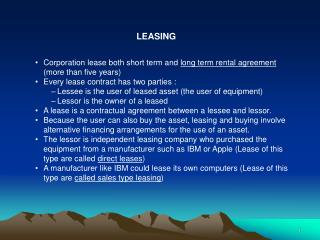
Global Equipment Leasing Markets in 2011 Canada CFLA 27 bil€ Japan JLA 41 bil€ 11% Leaseurope 232 bil€ 16% US ELFA 154 bil€ China CLBA 106 bil€ 1% 13% 100% Brazil ABEL 7 bil€ -28% Australia AELA & AFLA 16 bil€ 16% New equipment leasing volumes. ELFA figures do not include passenger car leasing Source: Leaseurope 2011 Annual Survey, local leasing associations, Leaseurope estimates
European Leasing Market in 2011 Evolution of new business by country New business, annual % change (2011/2010) 30% and higher 20% to 30% 10% to 20% 0% to 10% -10% to 0% - 20% to -10% - 20% and lower NA Non - members Source: Leaseurope 2011 Annual Survey Annual growth rates based on a homogenous sample of members reporting in Leaseurope’s 2011 Annual Statistical Enquiry and are adjusted for exchange rate fluctuations
European Leasing Market in 2011 Regional performance by movable asset category New business growth - annual % change (2011/2010) Benelux, AT,CH Nordic, Baltic DE UK FR IT* MED. CEE 80% 64% 60% 33% 40% 26% 18% 13% 18% 18% 15% 16% 15% 15% 16% 14% 20% 13% 10% 8% 12% 5% 4% 4% 3% 0% -2% -6% -10% -20% -13% -12% -24% -25% -30% -29% -40% -36% -40% -60% Machines & Equip ICT Vehicles Big/Other Growth rates are calculated based on a homogenous sample of members reporting & are adjusted for exchange rate fluctuations Source: Leaseurope 2011 Annual Survey * The category “Other” for IT includes some renewable energy assets
European Leasing Market in 2012 H1 2012/11 % -1.0% H1 2012 New volumes* 119 bil€ 30% and higher 20 % to 30% 10% to 20% 0% to 10% -10% to 0% -20% to -10% -20% and lower NA Source: Leaseurope Member Associations *28 member associations reporting; growth rates adjusted for exchange rate fluctuations
The use of leasing amongst European SMEs A report prepared for With the support of
Research on leasing to SMEs Rationale for the research • Lack of data at European level on SME’s use of leasing: • - European Central Bank Finance Survey – covers SMEs but doesn’t focus on leasing on its own, and only covers Eurozone countries • - EuropeanCommission’s Flash Barometer – right scope but out-of-date (pre-crisis) • - Leaseurope Annual Statistical Enquiry – detailed information on European leasing market, however no split by firm size • - National data sources – few; not directly comparable • This research establishes evidence at European level on the importance of leasing to SMEs as a source of financing their investment • Based on a unique survey of ~3 000 firms by telephone in 8 countries (DE, FR, UK, IT, ES, NL, PL and SE), across 9 sectors • The survey was carried out in July 2011 • Leasing defined in the broadest sense: right to use an asset for a period of time
How important leasing is to European SMEs - How many SMEs use leasing? - How intensively do they use leasing to finance investment? - What is the size of the SME leasing market? What assets do SMEs lease and through which channels? Why do SMEs lease (or not lease more)? About the role leasing play in driving SME investment and growth - Lessees invest more - Leasing enables SMEs to expand - Economic impact of more SME leasing Details on how to obtain your copy can be found on the SME report page of www.leaseurope.org What does the report tell us?
European SME investment through leasing 6 million SMEs used leasing in the 8 countries sampled €100 billion of SME investment in fixed assets was financed through leasing This represents 52% of the business leasing market in Europe & 45% of the total leasing market 2010 In comparison… • the European Investment Bank provided €10 bn in direct SME loans through banks • 63,000 SMEs supported • SME Guarantee Facility of the European Investment Fund (EIF) supported €1.2 bn in direct loans to SMEs • 20,000 SMEs supported • EIF invested €930 mil in 42 equity and mezzanine funds as SME support • Venture and enterprise capital helped finance 16,700 SMEs in Europe between 2007 and 2010, totalling €46.5 bn according to the European Venture Capital Association
How many European SMEs use leasing? • 40% of all SME firms used leasing in 2010 – more than any other individual form of external financing, and we expect more of them will in 2011 (43%) • - This equates to an estimated 6 million individual SMEs who rely on leasing in the 8 countries in our sample • - More SMEs use leasing than bank loans of > 3 years • - Use of leasing increases with SME size • - Micros generally make less use of all forms of external finance
Leasing as a share of SME investment • At EU level, leasing was responsible for financing just over €100 billion of SME investment in fixed assets in 2010 (€112.5 billion expected in 2011) • The share of SME investment financed by leasing is set to increase from 16.7% in 2010 to 18.6% in 2011. By contrast the share of all forms of bank lending taken together (loans, overdrafts, etc.) was 31% in 2010 and is expected to decrease in 2011 /Equity debt Loans of < 3 years Loans of > 3 years Short term credit (incl. overdrafts, credit cards)
Through which channels do SMEs access leasing? • The most important channel for accessing leasing is the vendor or point of sale channel – providing clients with a one stop shop for assets and financing solutions: • - 67% of lessees used the vendor channel in 2010 • - 58% accessed leasing through a banking channel • - 36% accessed directly from the lessor
Leasing is one of the funding sources that new firms are able to turn to most quickly - The use of leasing increases from 26% for SMEs less than 2 years old to 50% for SMEs aged between 2 and 5 years - The take-up of bank loans (> 3 years) increases from 29% to 38% for these age groups Leasing enables firms to expand faster Non-equity financing ST bank credit Firms using financing type by age Trade Credit 80% Leasing Loan >3 yrs 70% Loan <3 yrs Personal funds 60% Factoring 50% 40% 30% 20% 10% 0% < 2 years 2-5 years 5-10 years >10 years Source : Oxford Economics/EFG
Lessees invest more • On average, lessees invest 53% more than non-users of leasing. This trend also holds across sectors (except agriculture) and countries. • - Difference between lessees & non-users especially pronounced amongst small firms - small firms who leased in 2010 reported investing an average of €302 000, i.e. over €100 000 more than non-users. • - Small lessees in particular may invest more than non-users because they are taking advantage of one of the few external financing options available to firms of that size.
0.7 0.6 Why do firms lease? • Leasing is attractive to SMEs in many different circumstances and can meet the needs of diverse businesses Reasons to use leasing: Better price than other forms of finance Tax benefits Ability to finance up to 100% of the purchase price of an asset, without having to provide any supplementary guarantees or collateral Enables better cash flow management Ability to adapt the length of the contract according to your company’s needs Accounting benefits Predictability and transparency of rental payments Ability to use assets without bearing the risks of ownership e.g. risks on second hand asset values or the disposal of the asset Ability to upgrade and renew assets more frequently than purchasing would allow Ability to bundle finance with optional services e.g. installation, insurance, maintenance repair of the leased asset It is easier / faster to obtain leasing than other forms of finance 1=very important Rank 0=not at all important
Macro-economic contribution of increased leasing PR • Macro-economic contribution: • Baseline – Oxford Economics forecasts for GDP growth from 2010 onwards, assuming PR kept at 2010 rates. • Scenario 1 – Impact of firms leasing at 2011 PR vs 2010 PR What would the impact on potential output of a permanent shift to 2011 PR levels be? • Scenario 2 – micro firms increase leasing to small firm PR Micro firms currently finance 10% of investment via leasing. What if they increase this to 16.7% (small firms’ PR), but keep other investment constant? • Scenario 3 – “Leasing boom” Assumes all categories of firm increase PR from 2011 levels by the same amount as whole economy PR fell 2008-2010. This is the most ambitious scenario. Potential output under leasing scenarios in 2020 €trn, 2010 prices, total for FR, DE, IT, NL, PL, ES, SE and UK +1.5% on level of GDP Or + €200bn + 0.9 to 1.0% on level of GDP or + €100bn each
Leasing toEuropeanSMEs ALB |November 2012 Tanguy van de WerveLeaseurope Director General