Download
1 / 47
670 likes | 1.54k Views
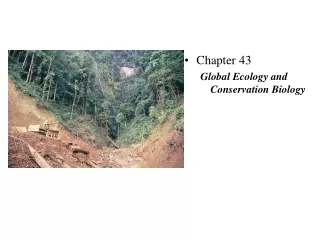
Global Ecology. Chapter 23. Outline. Atmospheric Envelope Greenhouse Effect El Nino Effects Tropical Deforestation Human Influence on Atmospheric Composition Depletion and Recovery of the Ozone Layer. Atmospheric Envelope.

E N D
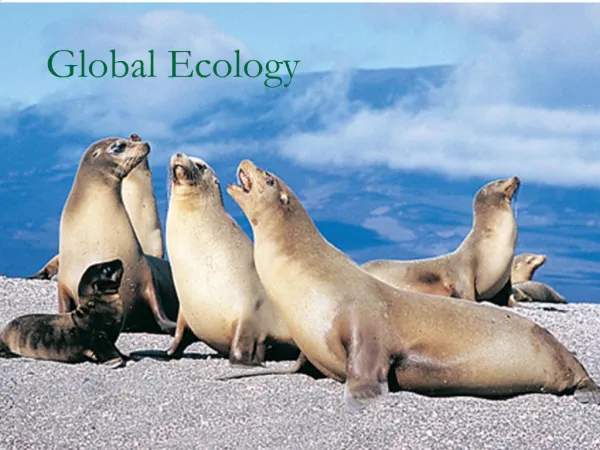
Global Ecology Chapter 23
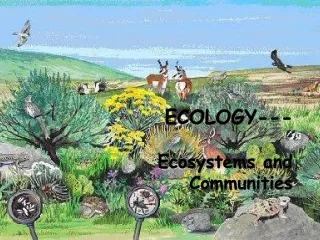
Outline • Atmospheric Envelope • Greenhouse Effect • El Nino • Effects • Tropical Deforestation • Human Influence on Atmospheric Composition • Depletion and Recovery of the Ozone Layer
Atmospheric Envelope • The earth is wrapped in an atmospheric envelope that makes the biosphere a hospitable place. • Clean, dry air at the earth’s surface is approx: • 78.08 % Nitrogen • 20.94 % Oxygen • 0.93 % Argon • 0.003 % Carbon Dioxide • 0.00005 % Ozone
Greenhouse Effect • Heat is trapped near the earth’s surface by greenhouse gases: • (Water Vapor, Carbon Dioxide, Methane, Ozone, Nitrous Oxide, and CFC’s)
Greenhouse Effect • Greenhouse gases absorb infrared and reemit most back to earth. • 30 % Solar energy reflected back by clouds, particulate matter, etc. • 70 % Absorbed by atmosphere/surface.
Greenhouse Effect • Three aspects of global change caused by humans: • Changes in the nitrogen cycle • Changes in landscapes • Changes in atmospheric carbon dioxide.
A Global System • The El Niño Southern Oscillation (ENSO), a large-scale atmospheric and oceanic phenomenon, influences ecological systems on a global scale. • During El Niño, a warm current appears off the coast of Peru. • Generally during Christmas season • Southern Oscillation refers to oscillation in atmospheric pressure that extends across the Pacific Ocean.
Historical Thread • Walker(1924) discovered the correspondence between barometric pressure across the Pacific and rainfall during monsoons. • Reduced barometric pressure in the eastern Pacific was accompanied by increased barometric pressure in the western Pacific and vice versa.
Historical Thread • Bjerknes: UCLA professor connected El Niño and Walker’s Southern Oscillation. • The gradient in sea surface temperature across the central Pacific produces a large-scale atmospheric circulation that moves in the plane of the equator.
El Niño and La Niña • ENSO is a highly dynamic, large-scale weather system that involves variation in sea surface temperature and barometric pressure across the Pacific & Indian Oceans. • This system drives climatic variability around the globe.
El Niño and La Niña • During mature phase, the sea surface in eastern tropical Pacific is much warmer than average and barometric pressure over the eastern Pacific is lower than average. • Promotes formation of storms over eastern Pacific, and increased precipitation to much of North America.
El Niño and La Niña • During El Niño, sea surface in the western Pacific is cooler than average and barometric pressure is higher than average. • Produces drought over western Pacific.
El Niño and La Niña • La Niña: Periods of lower sea surface temperatures and higher than average pressure in eastern tropical Pacific. • Drought to much of North America. • Higher than average precipitation in western Pacific.
El Niño and Marine Populations • Under average conditions, coastal waters are relatively cool along most of the west coast of South America. • Tongue of cool water extends westward. • Cool water brought to surface by upwelling. • Upwelling is driven by southeast trade winds along the coast and by east winds offshore.
El Niño and Marine Populations • During an El Niño event, easterly winds slacken and the pool of warm water in the Pacific moves eastward. • This warm water shuts down the upwelling, reducing nutrient supply, and reducing phytoplankton production. • Reproductive failure, migration, death occurs in fish populations.
El Niño and Marine Populations • Remote sensing of phytoplankton pigments in surface waters around the Galapagos Islands shows that the 1982-83 El Niño reduced the average primary production and changed the location of primary production hot spots.
El Niño and Marine Populations • These changes in rate & distribution of primary production caused the reproductive failure, migration, and widespread death of seabird populations in the Galapagos and along the coast of South America.
El Niño and Marine Populations • The 1982-83 El Niño also had an impact on fur seal and sea lion populations, through reductions in food supply.
El Niño and Great Salt Lake • Strong El Niños of 1982-83 and 1986-87 were the source of many storms deep into interior of North America. • Increased precipitation with Great Salt Lake basin. • 1983-87 lake rose 3.7 m.
El Niño and Great Salt Lake • Wurtsbaughand Smith Berry found lake salinity dropped by 50 g/l and the lake was invaded by predaceous insect Trichocorixa verticalis.
El Niño and Great Salt Lake • The invasion of the predator induced a trophic cascade. • Predator reduced population of brine shrimp from 12,000 to 74 per m3. • Phytoplankton biomass increased significantly. • By 1990, lake level fell 2.8 m, and salinity returned to 100 g/l. • All ecosystem changes were reversed.
El Niño and Kangaroo Populations • Red Kangaroos (Macropus rufus) occupy most of Australia’s semiarid interior. • During wet periods with plenty of food, females will simultaneously have a joey following, a younger offspring in the pouch, and an embryo waiting to enter the pouch.
El Niño and Kangaroo Populations • Under marginal conditions, most young die soon after leaving the pouch. • If food becomes scarce, females stop lactating and young die in embryo stage. • Kangaroos breed quickly and young enter the pouch within 60 days of onset of significant rainfall.
El Niño and Kangaroo Populations • By reproducing large numbers of offspring under favorable conditions, kangaroos increase the number of adults that will face El Niño induced droughts. • Cairns and Grigg found a tight coupling of M. rufus populations to El Nino.
Human Activity and Global Nitrogen Cycle • As human civilization developed intensive agriculture and industrial processes, we began to manipulate nitrogen cycle on massive scale.
Human Activity and Global Nitrogen Cycle • Vitousek tallied natural and manmade sources of nitrogen: • N - fixing bacteria/plants 100 Tg/yr • Marine environments 5-20 Tg/yr • Lightning 10 Tg/yr • Total Non-Human sources 130 Tg/yr • Nitrogen fixing crops 30 Tg/yr • Fertilizer industry 80 Tg/yr • Burning fossil fuels 35 Tg/yr • Total Human sources 145 Tg/yr
Human Activity and Global Nitrogen Cycle • Nitrogen fixation resulting from human activity fixes more nitrogen than all other sources combined.
Human Activity and Global Nitrogen Cycle • Human contributions to the global nitrogen cycle have increased exponentially. • Large scale nitrogen enrichment threatens the health of ecosystems and biological diversity.
Change in Land Cover • Rapid changes in global patterns of land use threaten biological diversity. • Agriculture and urbanization have significantly altered 1/3 to 1/2 of the ice-free land surface of the earth.
Tropical Deforestation • Tropical forests support at least half of earth’s species. • Skole and Tucker reported tropical forests occur in 73 countries and once covered 11,610,360 km2. • Brazil contains 1/3 of total. • Highest deforestation rate. • Estimated by 1978, 78,000 km2 deforested. • Annual rate of deforestation 1978-1988 was 15,000 km2.
Edge Effects and Tropical Deforestation • When a forest fragment is isolated due to cutting, its edge is exposed to greater amounts of solar radiation and wind. • Physical environment along forest edges is hotter and drier and solar intensity is higher. • Fragmentation decreases diversity of many animal groups.
Edge Effects and Tropical Deforestation • The majority of old-growth temperate forests in north-western North America has been cut. • Deforestation not limited to tropical areas.
Human Influence on Atmospheric Composition • Human activity is changing the composition of the atmosphere. • Most of the atmospheric increase in carbon dioxide is due to the burning of fossil fuels.
Human Influence on Atmospheric Composition • Record of atmospheric composition during last 160,000 years was extracted from ice cores in Greenland and Iceland. • Samples of atmosphere trapped in ice. • Core indicated two very large fluctuations in atmospheric CO2 concentrations. • 140,000 years ago. • 13,000 years ago.
Human Influence on Atmospheric Composition • Periods of low CO2 correspond to low temperatures experienced during ice ages, while high levels correspond to interglacial periods.
Human Influence on Atmospheric Composition • During 19th and 20th centuries, concentration of atmospheric CO2 increased dramatically.
Human Influence on Atmospheric Composition • Fossil fuel burning alone produces more than enough CO2 (5,600 Tg/yr) to account for recent atmospheric concentrations (3,500 Tg/yr). • Three major periods of interruptions: • World War I • Great Depression • World War II
Human Influence on Atmospheric Composition • Burning fossil fuels adds CO2 with little 14C. • The concentration of 14C was fairly stable from 1700 until 1850. • After 1850, 14C concentrations in wood declined significantly.
Depletion and Recovery of the Ozone Layer • In 1985, British Antarctic Survey discovered major reduction in atmospheric ozone. • Ozone absorbs potentially harmful ultraviolet light. • UV-B radiation – capable of destroying biological molecules.
Depletion and Recovery of the Ozone Layer • Attention focused on stopping chlorofluorocarbons (CFCs). • As CFCs breakdown, they release chlorine, which can act as a catalyst to break down ozone molecules. • Each chlorine can break down many ozone molecules. • 1987 Montreal Protocol – reduce/eliminate human generated substances that deplete ozone.
Depletion and Recovery of the Ozone Layer • As a result of the 1987 Montreal Protocol, global production of CFCs has been reduced from over one million tons annually to less than 50,000 tons in 2003. • Even after the protocol went into effect, the hole continued to grow. • Largest hole to date in 2000. • 2003 saw first reported evidence the ozone layer is recovering.
The Future • During the past century, the average global temperature has risen 0.7°C. • It is predicted that without reductions in greenhouse gases, global temperatures will increase and additional 1.5° to 5.5°C over the next century.
The Future • Predicted consequences of this global increase in temperature include: • Increased frequency of intense hurricanes • Melting glaciers – rising sea level • More intense, more frequent heat waves in temperate areas • Increased summer drought in semi-arid areas • Increased coral mortality • Potential spread of insect-transmitted diseases • Dieback of forests due to increased disease & insects • Increased wildfires • Widespread extinctions • Release of CO2 and CH4 from arctic soils, accelerating global warming
The Future • Knowledge of ecology will play a key role in our quest to reduce and reverse the damage we have caused to our planet.