Download

1 / 33
330 likes | 458 Views
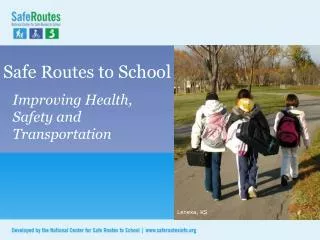
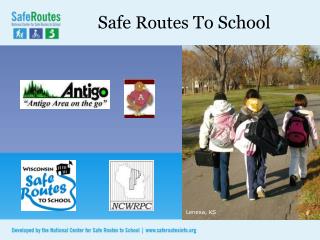
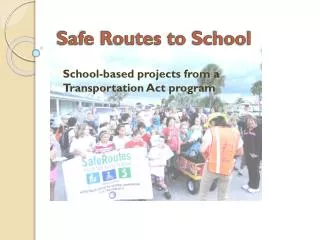
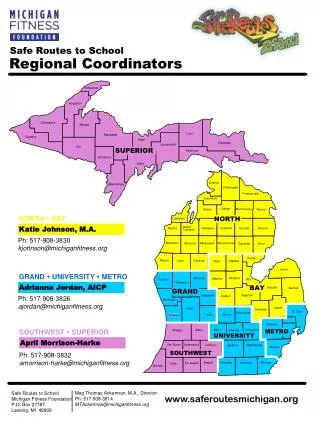
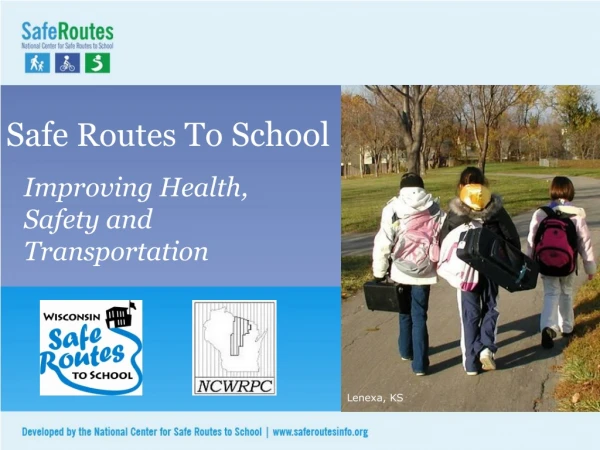
Safe Routes to School. Improving Health, Safety and Transportation. Lenexa, KS. The need for Safe Routes to School. Fewer kids today walk and bike to school Unintended consequences have resulted SRTS programs are part of the solution.

E N D
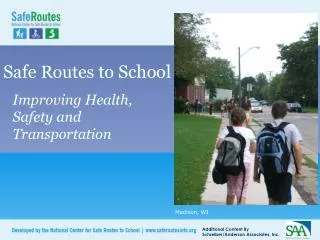
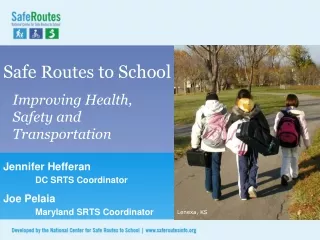
Safe Routes to School Improving Health, Safety and Transportation Lenexa, KS
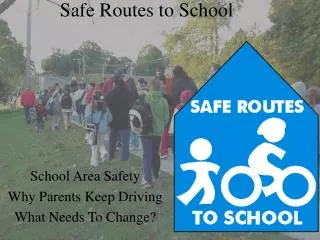
The need for Safe Routes to School • Fewer kids today walk and bike to school • Unintended consequences have resulted • SRTS programs are part of the solution
1. Fewer kids are biking and walking. More parents are driving. • 2001: 16% walked • 1969: 42% walked (CDC, 2005)
Parents driving Parents driving children to school: 20%-25% of morning traffic (NHTSA 2003; Dept. of Environment)
School siting issues: A generation ago • Small schools • Located in community centers (EPA, 2003)
School siting issues: Today • Mega-schools • Built on edges of towns and cities
School consolidation has lengthened the trip between home and school
It’s not just distance Students who live within 1 mile and walk or bike: 2001: 63% 1969: 87% (CDC, 2005)
Most common barriers to walking and bicycling to school • Long distances 62% • Traffic danger 30% • Adverse weather 19% • Fear of crime danger 12% Note: Sum of percentages is more than 100% because respondents could identify more than one barrier. (CDC, 2005)
Adverse weather Centreville, VA Howard’s Grove, WI
Individual community issues • Fear of crime (both real and perceived) • Abandoned buildings • Other reasons
2. What are the unintended consequences of less walking and bicycling? • For the environment • For individual health
1996 Summer Olympic Games banned single occupant cars in downtown Atlanta Atlanta, GA
Results of the ban • Morning traffic – ä 23% • Peak ozone – ä 28% • Asthma-related events for kids – ä 42% (Journal of the American Medical Association [JAMA], 2001)
Air quality Measurably better around schools with more walkers and bicyclists (EPA, 2003) Chicago, IL
Physical inactivity • Most kids aren’t getting the physical activity they need • Recommended 60 minutes on most, preferably all, days of the week (US Depts. of Health and Human Services and Agriculture, 2005)
U.S. youth overweight rates (National Center for Health Statistics)
Overweight children have an increased risk of… • Type 2 Diabetes • Low self esteem • Decreased physical functioning • Obesity in adulthood • Many other negative emotional & physical effects (Institute of Medicine, 2005)
Good news! Communities are taking action on behalf of children through Safe Routes to School Winston-Salem, NC Alhambra, CA Phoenix, AZ
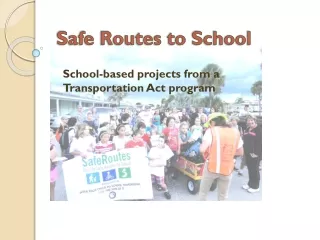
3. Safe Routes to School programs are part of the solution… ...to improve walking and bicycling conditions ...to increase physical activity ...to decrease air pollution Dallas, TX
More benefits of SRTS programs • Reduce congestion around schools • Can lead to cost savings for schools(reduce need for “hazard” busing) • Others: increase child’s sense of freedom, help establish lifetime habits, teach pedestrian and bicyclist skills
Elements of SRTS programs • Education • Encouragement • Enforcement • Engineering • Evaluation Lenexa, KS
Education • Imparts safety skills • Creates safety awareness • Fosters life-long safety habits • Includes parents, neighbors and other drivers Chicago, IL
Encouragement • Increases popularity of walking and bicycling • Is an easy way to start SRTS programs • Emphasizes fun
Enforcement • Increases awareness of pedestrians and bicyclists • Improves driver behavior • Helps children follow traffic rules Richmond, VA Denver, CO
Engineering • Creates safer conditions for walking and bicycling • Can influence the way people behave West Valley City, UT
Evaluation Is the program making a difference?
Federal Safe Routes to School program • $612 million to States 2005-2009 • Funds infrastructure and non-infrastructure activities • Requires State SRTS Coordinators More information: www.saferoutesinfo.org
State program Insert state program info here
Safe Routes to School goals • Where it’s safe, get children walking and biking • Where it’s not safe, make changes Winston-Salem, NC