Quantitative Methods PSY302 Quiz 6 Confidence Intervals
Quantitative Methods PSY302 Quiz 6 Confidence Intervals. 1. We can’t assume that the sample mean will equal the population mean because of _____. (104). skewness outliers in the data sampling error confirmation bias anhedonia.

Quantitative Methods PSY302 Quiz 6 Confidence Intervals
E N D
Presentation Transcript
1. We can’t assume that the sample mean will equal the population mean because of _____. (104) • skewness • outliers in the data • sampling error • confirmation bias • anhedonia
1. We can’t assume that the sample mean will equal the population mean because of _____. (104) • skewness • outliers in the data • sampling error • confirmation bias • anhedonia
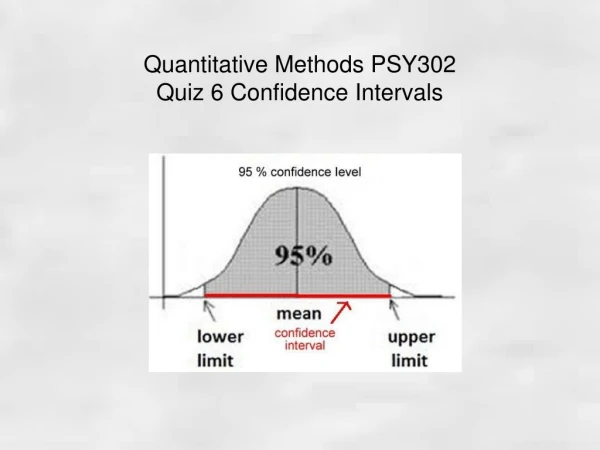
2. What is a confidence interval for the mean? It is a(n) _________within which the true mean of the population is believed to exist. (105) • standard deviation • non random sample • research design or meta-analysis • frequency distribution • range of values
2. What is a confidence interval for the mean? It is a(n) _________within which the true mean of the population is believed to exist. (105) • standard deviation • non random sample • research design or meta-analysis • frequency distribution • range of values
3. A ____ is a point along the baseline of the normal curve that is expressed in standard deviation units. (107) • distribution of critical values • Z value • confidence interval • categorical variable • sum of squares
3. A ____ is a point along the baseline of the normal curve that is expressed in standard deviation units. (107) • distribution of critical values • Z value • confidence interval • categorical variable • sum of squares
4. To calculate a confidence interval we need to:(106) • add something to the mean • subtract something from the mean • know the true value of the parameter • a & b • all of the above
4. To calculate a confidence interval we need to:(106) • add something to the mean • subtract something from the mean • know the true value of the parameter • a & b • all of the above
5. In a distribution with a mean of 40 and a standard deviation of 5 what values would encompass approximately 95% of the scores? • 35-45 • 30-50 • 25-55 • 40-95 • all of the above
5. In a distribution with a mean of 40 and a standard deviation of 5 what values would encompass approximately 95% of the scores? • 35-45 • 30-50 • 25-55 • 40-95 • all of the above
6. We use the symbol ____ to represent the sample size. (111) • μ • b • σ • n • s
6. We use the symbol ____ to represent the sample size. (111) • μ • b • σ • n • s
7. As n increases the standard error: (111) • remains the same • increases • decreases • doubles • turns to zero
7. As n increases the standard error: (111) • remains the same • increases • decreases • doubles • turns to zero
8. When you divided the standard deviation of the population by the square root of n (the sample size) you have the: • standard error • mean • correlation coefficient • confidence interval • sum of squares
8. When you divided the standard deviation of the population by the square root of n (the sample size) you have the: • standard error • mean • correlation coefficient • confidence interval • sum of squares
never always 99% of the time 95% of the time On president’s day 9. A 95% confidence interval is constructed so that it will capture the true mean of the population: (115) The error bars on the figures represent the 95 percent confidence interval.
never always 99% of the time 95% of the time On president’s day 9. A 95% confidence interval is constructed so that it will capture the true mean of the population: (115) The error bars on the figures represent the 95 percent confidence interval.
10. When calculating a confidence interval and the standard deviation of the population is unknown you have to: • guess • calculate the sum of squares • estimate the value of the population standard deviation. • sacrifice a gray squirrel to the gods • change your data to categorical variables and use chi square
10. When calculating a confidence interval and the standard deviation of the population is unknown you have to: • guess • calculate the sum of squares • estimate the value of the population standard deviation. • sacrifice a gray squirrel to the gods • change your data to categorical variables and use chi square
Bonus Question: We have two ways of dealing with sampling error one of them is: • A frequency distribution • A correlation coefficient • A hypothesis test • A random number generator • All of the above
Bonus Question: We have two ways of dealing with sampling error one of them is: • A frequency distribution • A correlation coefficient • A hypothesis test • A random number generator • All of the above
Bonus question number two. We have two ways of dealing with sampling error: hypothesis test and: • Z scores • Confidence intervals • Multiple regression • Scatter plots • Histograms and density curves
Bonus question number two. We have two ways of dealing with sampling error: hypothesis test and: • Z scores • Confidence intervals • Multiple regression • Scatter plots • Histograms and density curves
c • c • b • d • b • d • c • a • d • c