Download
1 / 60
610 likes | 730 Views
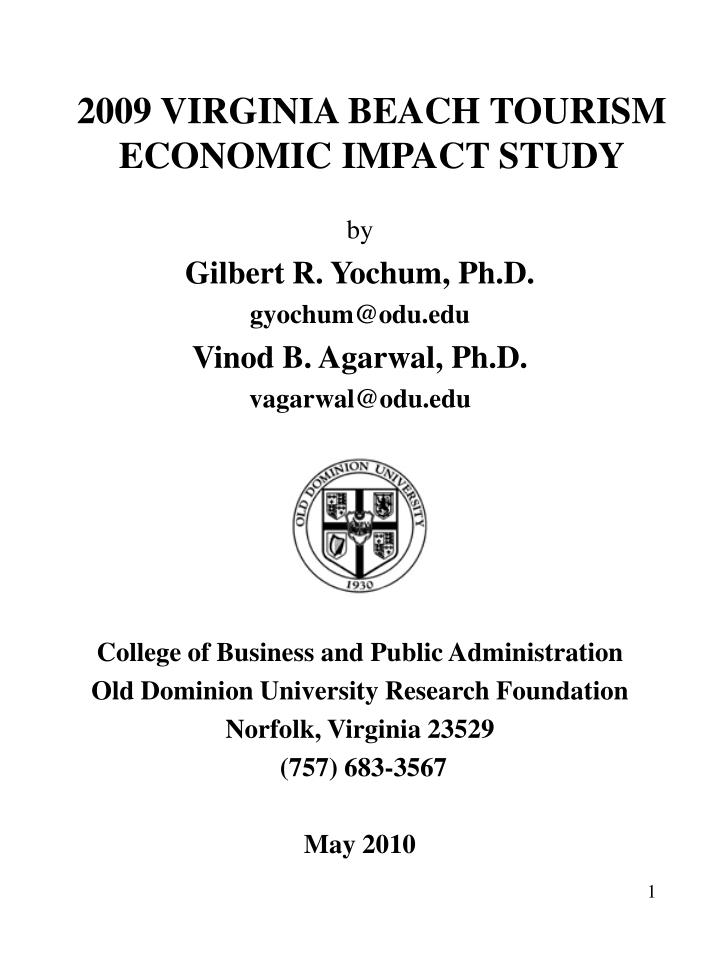
2009 VIRGINIA BEACH TOURISM ECONOMIC IMPACT STUDY. by Gilbert R. Yochum, Ph.D. gyochum@odu.edu Vinod B. Agarwal, Ph.D. vagarwal@odu.edu College of Business and Public Administration Old Dominion University Research Foundation Norfolk, Virginia 23529 (757) 683-3567 May 2010.

E N D
2009 VIRGINIA BEACH TOURISMECONOMIC IMPACT STUDY by Gilbert R. Yochum, Ph.D. gyochum@odu.edu Vinod B. Agarwal, Ph.D. vagarwal@odu.edu College of Business and Public Administration Old Dominion University Research Foundation Norfolk, Virginia 23529 (757) 683-3567 May 2010
TABLE OF CONTENTS Introduction3 2009 Virginia Beach Visitor Annual Summary6 Direct City Taxes and Fees ……………………………………………………8 Economic Impacts9-16 Direct City Taxes and Fees from Businesses that have Direct Contact with Visitors by Type of Tax, 200917 Direct City Expenditures for Tourism, 200918 Estimated Average Rate of Return from City of Virginia Beach 2009 Tourism Expenditures19 Estimated Overnight Visitors in Virginia Beach, 200920 Estimated Direct Spending by Visitors in Virginia Beach, 2009………………………21 Distribution of Visitors Staying Overnight in Virginia Beach by Type of Lodging, 2009.22 Distribution of Total Visitor Spending by Type of Lodging, 200923 City of Virginia Beach Hotel Rooms, 1981-200924 Virginia Beach Hotel Capacity Utilization, 200925 Overnight Visitors on Beach and Boardwalk, 2009 Selected Demographic Data26 Appendix I27 Appendix II33 Appendix III39 Appendix IV49 Appendix V51 Appendix VI53 Appendix VII54 Appendix VIII57
Introduction Study Objectives The purpose of this study is to estimate the total economic impact and the direct taxes and fees generated by the 2009 in-flow of visitors to the City of Virginia Beach’s tourist industry. Total tourism economic impact is defined as the sum of direct, indirect and induced output, employment and earnings that result from visitor spending in Virginia Beach. Direct taxes and fees are the total payments to the City whose ultimate source are businesses that have direct contact with visitors. The estimation of 2009 visitor generated direct taxes and fees allows for their comparison with estimated city tourist related expenditures in 2009, a net measure that can be viewed as profit. This comparison permits an examination of the net inflow/outflow of revenue to the City that results from businesses that have direct contact with visitors and from City spending to attract those visitors. The Tourist Industry What is the tourist industry? For that matter, what is tourism? As with industries such as those that create automobiles, steel, chemicals and the myriad of products produced in the U.S., the U.S. Government has set the standards for defining and measuring the tourist industry. The series of definitions central to defining the tourist industry that immediately follow are those of the U.S. Department of Commerce (for citations and further details see Appendix I). They are arranged in sequence in order to give the reader a solid basis from which to understand and evaluate the industry, its quantitative measurement and its subsequent economic impact on Virginia Beach. These definitions form the basic building blocks of this study. Visitor: “A visitor is a person who either travels outside of his or her “usual environment” for a period of less than a year or who stays overnight in a hotel or motel. The person may travel for personal pleasure or on industry or government business.” (Italics added) Usual Environment: “The usual environment is defined as the area within 50-100 miles of home, depending on available data sources.” Tourism: “The activities of visitors while traveling.”
Tourism Commodities: “Tourism commodities are the commodities typically purchased by visitors directly from producers.” Tourism Employment: “All jobs that involve the production of tourism output.” Tourism Industries: “Industries that include tourism commodities as a primary product are classified as tourism industries.” Tourism Industry Total Output: “a measure of the value of domestically produced goods and services for tourists and all supporting production.”
Study Presentation The study is organized with the summary of results presented first and details of the method and additional information as follows: Appendix I: Definitions and General Methodology Appendix II: Detailed Methodology: Direct Impact Appendix III: Detailed Methodology: Indirect and Induced Impact Appendix IV: Time Series Data Appendix V: Other Studies Appendix VI: Data Sources Appendix VII: City Operating and Capital Expenditures. Appendix VIII: Indirect, Induced and Total Effects of Visitors Spending .
2009 Virginia Beach Visitor Annual Summary This study is designed to estimate the direct impact of visitors’ spending in 2009 and the subsequent total economic impact that visitor spending creates in the City of Virginia Beach. The first step in this process is to estimate visitor spending from primary data sources that include a series of visitor surveys and government tax and demographic data. From the visitor spending estimates, the total economic impact is simulated within an economic model of Virginia Beach. City Direct Tax & Fee Breakwater Direct Effect Imports Indirect Effect Induced Effect Imports Visitor Spending Imports Output Earning Employment Output Earnings Employment Output Earnings Employment Visitor Spending Visitor Spending Imports Imports Imports Tourism: An Economic Tsunami
One image useful to comprehending the total economic impact of visitor spending, the source of which originates from outside ofan area, is to think of the way energy is released from a tidal wave. The wave may hit a breakwater that absorbs some of its momentum but it will continue on to wash over the beach hinterland until all of its energy is spent. Likewise, dollars spent by visitors to Virginia Beach flow through the City’s economy creating taxes, spending, earnings and jobs. Though the initial energy of the spending is absorbed by taxes at the point of sale, as well as by those industries that have “direct” contact with visitors, the effect of the spending flow continues through the City’s economy. For example, industries that have direct contact with visitors pay employees, pay additional taxes and purchase goods and services from intermediate suppliers. Some of the goods and services are “imported” from suppliers located outside of Virginia Beach so that the economic energy of visitor spending leaks away and is incrementally dissipated. However, some suppliers to the industries that have direct contact with visitors are located in Virginia Beach. Output, earnings and jobs are created in Virginia Beach within these “indirect” industries that meet the factor demands of the industries with direct visitor contact. The final burst of economic energy created by the flow of visitor spending is expended by subsequent purchases from Virginia Beach industries whose source is spending “induced” by the household earnings created in the direct and indirect industries. Visitors to Virginia Beach spent an estimated $816 million in 2009. Based on our simulation of the effect of this spending, we estimate that the total economic impact of visitor spending, the sum of the direct, indirect and induced effects described above, is roughly $1.34 billion dollars of output from Virginia Beach industries, 12,500 jobs and $323 million dollars in earnings in Virginia Beach in 2009. 2009 visitor spending was responsible for generating about 9,000 jobs and $77.9 million in taxes and fees paid to Virginia Beach from those industries having direct contact with visitors. To help attract both new and repeat visitors, as well as to provide additional services to residents, the City of Virginia Beach spent an estimated $68.7 million in tourist related expenditures in 2009. Net revenue was $9.2 million, resulting in a net average return on expenditures of 13.4% to the City of Virginia Beach. Further, the total value of state sales tax derived from visitor spending in Virginia Beach in 2009 is estimated to be $36.3 million. However, a portion of this amount, $12.0 million, is returned directly to the City of Virginia Beach in the form of the local option and education transfers. Therefore, the sales tax retained by the Commonwealth of Virginia as a result of visitor spending in Virginia Beach in 2009 is estimated at $24.3 million.
Taxes & Fees Accruing to the City = $77.9M * Sales & License Sales, Room Night Special District BPOL *Property (Tourist Industry) Real Property Personal Property *Other Utilities, Convention and Visitors Bureau, Alcohol, Cigs, and Parking Visitor Spending $815.7M Visitor Spending Direct City Taxes & Fees: Taxes and Fees on Industries that have Direct Contact with Visitors (Accommodations, Food and Beverage Establishments, Retail and Entertainment) that accrue to the City
Direct Effect of Visitor Spending on Output, Employment and Earnings in Virginia Beach’s Private Sector Industries that have Direct Contact with Visitors. City Direct Tax & Fee Breakwater Direct Effect Imports Indirect Effect Induced Effect Imports Visitor Spending Imports Output Earnings Employment Output Earnings Employment Output Earnings Employment Visitor Spending Imports Imports Imports
Indirect Effect of Visitor Spending on Output, Earnings and Employment in Virginia Beach Private Sector Industries that Provide Goods and Services to Virginia Beach Businesses that have Direct Contact with Visitors City Direct Tax & Fee Breakwater Direct Effect Imports Indirect Effect Induced Effect Imports Visitor Spending Imports Output Earnings Employment Output Earnings Employment Output Earnings Employment Visitor Spending Imports Imports Imports
Indirect Effect of Tourism: Estimated 2009 Output and Jobs Created in the Top PrivateSector Virginia Beach Industries that Provide Goods and Services to Virginia Beach Businesses that have Direct Contact with Visitors.
Induced Effect of Visitor Spending on Private Sector Output, Earnings and Employment in Virginia Beach. Induced Effects Result from the Increase in Virginia Beach Household Income Created by the Direct and Indirect Effects of Visitor Spending City Direct Tax & Fee Breakwater Direct Effect Imports Indirect Effect Induced Effect Imports Visitor Spending Imports Output Earnings Employment Output Earning Employment Output Earnings Employment Visitor Spending Imports Imports Imports
The Induced Effect of Visitor Spending on Output and Employment in the Top Private Sector Virginia Beach Industries. Induced Effects Result from the Increase in Virginia Beach Household Income Created by the Direct and Indirect Effects of Visitor Spending
Total Private Sector Effect of Visitor Spending on Output, Employment and Earnings in Virginia Beach in 2009 City Direct Tax & Fee Breakwater Direct Effect Imports Indirect Effect Induced Effect Imports Visitor Spending Imports Output Earning Employment Output Earnings Employment Output Earnings Employment Visitor Spending Imports Imports Imports
Total Tourism Economic Impact: Summed Effect of Visitor Spending on Government and Private Sector Output, Earnings and Employment in Virginia Beach in 2009
Each $1 Million of Additional Visitor Spending in Virginia Beach Creates an Estimated: • 15 new jobs in Virginia Beach • $374,400 in additional earnings for Virginia Beach employees and business owners • $1.59 Million in additional output in industries located in Virginia Beach
Direct City Taxes and Fees from Businesses that have Direct Contact with Visitors, 2009* *Includes Convention and Visitors Bureau (CVB) Revenue
Direct City Expenditures for Tourism, 2009* Source: City of Virginia Beach. *See Appendix for a listing of expenditure categories.
Estimated Average Rate of Return from City of Virginia Beach 2009 Tourism Expenditures $9.2M Net Direct City Return* _________________________________________________________ $68.7M Direct City Expenditures = 13.4% *Net Direct City Return = Revenue (Direct City Taxes and Fees)- Expenditures (Direct City Expenditures)
Estimated Overnight Visitors in Virginia Beach, 2009Total Overnight Visitors = 2.45 million
Estimated Direct Spending by Visitors in Virginia Beach, 2009Total Spending =$815.7M
Distribution of Visitors Staying Overnight in Virginia Beach by Type of Lodging, 2009
Virginia Beach Hotel Capacity Utilization, 2009 332.3 302.6 340.9 337.3 355.0 345.5 355.0 355.0 343.5 355.0 332.3 338.8 Source: Room nights available, Smith Travel Research Trend Report March 18, 2010; Room nights occupied, City of Virginia Beach. An alternative method for estimating hotel utilization could compare STR room supply with STR room demand. The former technique is used because in this study all intra-City comparisons use City tax data where available.
Overnight Visitors On Beach And Boardwalk, 2009 Selected Demographic Data • *These surveys were conducted on Beach, Boardwalk, Atlantic Avenue and at hotels. • ** These figures represent surveys for May and September only.
APPENDIX I: CORE DEFINITIONS AND GENERAL METHODOLOGY Definitions: In estimating the economic impact of tourism in Virginia Beach, this study follows the definitions of assessing the economic value of the U.S. tourist industry established by the U.S. Department of Commerce, Bureau of Economic Analysis (BEA) in the creation of its Tourism Satellite Accounts. (See for example the Survey of Current Business, U.S Department of Commerce, June 2005, p.20). It is also noteworthy that tourist industry definitions are standardized worldwide. See for example the United Nations Statistics Division’s Tourism Satellite Account: Recommended Methodological Framework, United Nations publication sales no: E.01.XVII.9, c2001). Although the tourist industry does not fall under the definitional framework of the North American Industry Classification System (NAICS), the BEA has created the tourism account by identifying “commodities that are purchased by visitors and the corresponding industries (NAICS) that produce these commodities.” (“U.S. Travel and Tourism and Satellite Accounts for 1992”, Survey of Current Business, U.S. Department of Commerce, July 1998, p.8). For a description of some of the terms used in the national account see “U.S. Travel and Tourism Satellite Accounts for 2001-2004” in the June 2005 issue of (1) the Survey of Current Business, pages 17 to 29 (especially page 20) and (2) “U.S. Travel and Tourism and Satellite Accounts for 1992” (especially p. 11). The following terms used in this study are defined in the preceding two publications of the U.S Department of Commerce. These definitions set the standard in defining the measurement of the tourist industry: Visitor: “A visitor is a person who either travels outside of his or her “usual environment” for a period of less than a year or who stays overnight in a hotel or motel. The person may travel for personal pleasure or on industry or government business.” (2, p.11) (Italics added) Usual Environment: “the usual environment is defined as the area within 50-100 miles of home, depending on available data sources.” (2, p. 11) (Note: The intensive survey technique used by Continental Research Inc. in conducting the visitor surveys employed by this study allow for use of the 50 mile visitor definition). Tourism: “The activities of visitors while traveling.” (2, p.11) Tourism Commodities: “Tourism commodities are the commodities typically purchased by visitors directly from producers.” (2 p.11) Tourism Output: “Domestically (Virginia Beach) produced tourism goods and services purchased by travelers” (1, p.20) (Parenthesis added)
Tourism Employment: “All jobs that involve the production of tourism output.” (1, p.20) Tourism Industries: “Industries that include tourism commodities as a primary product are classified as tourism industries.” (2, p.12) Tourism Industry Total Output: “a measure of the value of domestically produced goods and services for tourists and all supporting production.” (1, p. 17) In addition to the above definitions that conform to BEA standards for measuring the tourist industry this study will rely on the following definitions of taxes, visitor accommodations and earnings. These definitions, of taxes, visitor spending, rate of return and earnings can be interpreted as minimum estimates of the tourist related industry’s economic effect on the City of Virginia Beach, as explained below. Tourism Demand: Travel related expenditures by visitors. Total Tourism Demand: Total direct expenditures of all visitors. Total Tourism-Related Output: Direct tourism output plus indirect output created by enterprises that support direct output. (The related industries’ total output can be identified as the sum of direct and indirect output in Virginia Beach that results from visitor spending.) Direct Taxes and Fees: Taxes and fees paid by only those businesses with direct contact with visitors or fees paid directly to the city government (CVB) by visitors. This study does not include taxes paid to the City of Virginia Beach by businesses affected by the indirect and induced effects of visitor spending, by households who have family members who work in a business with direct contact with visitors, or payment of taxes and fees by resident households that resulted from the addition to household income generated by total tourism related output. For example, the taxes (property, sales, utility and etc.) paid by a hotel manager who earns a living in the hotel industry or, the taxes paid by an accountant who earns a living working for an auditing firm that provides services to the hotel industry are not included. Visitor Accommodations: Includes hotels, campgrounds and seasonally leased houses and condominiums in Sandbridge and the North End. This study does not include the approximately 1,500 seasonally rented or vacation houses and condominiums located inside Virginia Beach but outside of Sandbridge or the North End. The Department of Commerce recommends including such housing in estimates of economic output in the tourist industry (see for example a paper by a group of BEA economists, Okubo, Fraumeni
and Fahim-Nader, Expanded U.S. Travel and TourismSatellite Accounts: Extension to Include Imputed Services of Motor Vehicles and Vacation Homes, presented at the Canadian Conference on Tourism Satellite Models, 2001, or U.S. Tourism and Satellite Accounts for 1992, Survey of Current Business, U.S. Department of Commerce, July 1998, p.12.) Because of data limitations, imputed rent and spending for these properties are not included in this study and therefore imply an underestimation of tourism’s economic impact on Virginia Beach. Total Tourism Economic Impact: The total or sum of direct, indirect and induced effects on employment, earnings, spending and taxes that are created as a consequence of visitor spending in Virginia Beach. Economic impact is simply the sum of identified tourist industry activities that create an estimated sum of spending, taxes and government expenditures. No comparison with other alternative economic activities to tourism, or what might take place should it vanish, is considered or implied. Average Rate of Return from Tourism Expenditures: The flow of net revenue (revenue minus expenditures), generated by businesses and government institutions that have direct contact with Virginia Beach visitors, that accrues to the City in a given time period divided by the flow of City visitor related expenditures in the same period. This rate does not include revenue accruing to the City from direct, indirect or induced earnings or indirect and induced private sector taxes. This rate represents an average and should be thought of as a rate of profit (Total Revenue-Cost/Cost). This rate does not represent marginal returns on expenditures. Earnings: The sum of wages and salaries, proprietor’s income, director’s fees and employer contributions to health insurance less personal contributions to social insurance. This is the definition of earnings used by the U.S. Department of Commerce in its RIMS II model. General Methodology Direct Effect: Given that the City of Virginia Beach’s tourism dedicated expenditures are directed toward attracting visitors, this study is designed to measure the economic impact of onlythein-flowof domestic and international visitors to Virginia Beach. The basic procedure followed in the estimation of Virginia Beach’s direct tourism economic impact relies on data provided by a series of visitor surveys conducted by a professional survey research firm designed to allow for the estimation of visitor spending within NAICS categories. All surveys are conducted within the local area. The survey is administered concurrent with a visitor’s stay, or in the case of friends and family visits, both by the visitor survey and a telephone survey of families with visitors. In addition tax, accommodation room night and expenditure data are provided by the City of Virginia Beach. Employment is estimated from the RIMs II economic model of Virginia Beach. These data are corroborated with outside data (if available) from sources
such as the Virginia Department of Taxation, the Virginia Auditor of Public Accounts, the Virginia Employment Commission (VEC) establishment data files, Smith Travel Research, the U.S. Department of Commerce and national surveys conducted by consulting firms and the U.S. government. Indirect and Induced Effect: Indirect supplier inputs and the induced general economic effects of tourism are modeled and estimated using the latest version (2006) of the U.S. Department of Commerce, Bureau of Commerce, Bureau of Economic Analysis (BEA) 2006 Regional Industry Modeling System (RIMS II). The effects of visitor commodity purchases are modeled in the NAICS category designated by the BEA as part of the Tourism Satellite Accounts. A detailed description of this method and the algorithms used in its application are presented in Appendix III . Economic Impact Components Not Estimated in This Study Economic impact studies, especially those based on survey data, as is the case with studies of tourism, are by their nature attempts to approximate actual economic events. At their best economic impact studies conducted over a series of years, as with the creation of a statistical time series of economic data, will attempt to successively approximate economic events with incremental improvements in analysis as a better understanding of the subject, better methods or better data become available. At times however, restrictive assumptions that may be part of a study’s objectives, the lack of method, lack of available data or the absence of reasonable alternatives for making a statistical judgment may limit efforts to take a more comprehensive measure of economic impact or to draw reasonable inferences from existing information. For example, this study can be thought of as a minimum estimate of the aggregate economic impact of visitor spending in Virginia Beach in 2008. Not included in the Total Tourism Economic Impact are: 1. Taxes and revenue that accrue to the City of Virginia Beach as a result of increased earnings of direct, indirect and induced effects are not included in the tax and fee estimates. In addition, taxes paid by businesses that result from the indirect and induced effect of tourism are not estimated. Only the taxes and fees collected and paid by businesses that have direct contact with visitors and revenue of the CVB are estimated under direct taxes and fees. 2. With the exception of direct Virginia Beach government employment, City payment for tourist based goods and services are not included in this study’s economic impact estimate. For example, the money spent on building the new convention center and any of its indirect or induced effects are not counted as part of the 2008 economic impact. There are two reasons for this: first, we do not know how much of this type spending is contracted for
with businesses that are located in Virginia Beach. It is possible that all spending of this type is contracted for with businesses located outside of Virginia Beach and would therefore be properly categorized as spending on imports to the City with no resulting economic impact. Second, City spending on special projects is transitory by nature. Adding such projects may mask period-to-period changes in the core tourist industry. 3. Large private sector variance in spending on tourist commodities or infrastructure is not included in this study. For example, the base year of the input-output model used in this study is 2006. Large or unusual increases in construction spending for hotels in 2008 relative to 2006, will therefore not be accounted for in this model. Those data could be accounted for outside of the model but we do not currently have information on the either the magnitude of such spending or whether or not Virginia Beach firms were the recipients of it. 4. Data constraints may lead to underestimation of the direct visitor spending impacts. For example, as mentioned above, although recommended by the Department of Commerce this study does not include the direct visitor spending of approximately 1,500 seasonally rented or vacation houses and condominiums located inside Virginia Beach but outside of Sandbridge or the North End. Real estate taxes paid for these properties are not estimated. 5. Because it is difficult to estimate the real estate taxes paid by eating establishments located in malls, hotels and larger buildings these taxes are not included in estimates of taxes and fees. 6. Time share taxes and revenue are not readily available. In particular, estimating time share implicit rent requires the ability to distinguish Virginia Beach resident owners from those owners residing outside of Virginia Beach. 7. Only in-flows of visitors are considered in this analysis of the tourist industry. Other studies that use the Satellite Account method, which requires identification of visitor spending through NAICS codes, may include both the in-flow of visitors to a region as well as the out-flow of visitors from a region. 8. In the estimation of visitors staying at hotels, this study relies on City room night data. These data create a recognized underestimate of visitors and spending because they do not include those visitors who do not pay room night taxes. Alternatively, STR data does include visitors who do not pay room night taxes. However, as we have detailed elsewhere, (Agarwal, Yochum and Isakovski, An Analysis of Smith Travel Occupancy Estimates: A Case Study of Virginia Beach, Cornell Hotel and Restaurant Quarterly, vol. 43, no. 2, April 2002) STR data may overestimate visitors. We have choose the more conservative estimation technique in this study.
Satellite Accounts and the Virginia Beach Economic Impact Study This study, using the survey I-O methodology outlined above, follows the definitions of tourism demand set out by the U.S. Department of Commerce and focuses, as suggested by Michigan State University Professor Daniel Stynes (“Estimating Economic Impacts of Tourist Spending on Local Regions: A Comparison of Satellite and Survey/I-O Approaches” p.8, a paper for presentation at Censtates, TTRA, Sept 20, 2001), particularly on visitorstoVirginia Beach and the resulting economic impact of that inflow demand. As with the satellite account method, this study links visitor spending to the NAICS industries that produce tourism goods and services in order to fully implement the I-O Model. Wilkerson (“Travel and Tourism: An Overlooked Industry in the U.S.” Tenth District Economic Review, Federal Reserve Bank of Kansas City, Third Quarter, 2003) suggests a method for Federal Reserve district regions, states and localities that uses national satellite account industry ratios and relative employment statistics by NAICS industry to estimate the size of the tourism industry in a region or locality. For example, applying Wilkerson’s suggested technique (not used in this study), national satellite account and industry employment data applied to food service and drinking places (restaurants) would suggest that about 27.4 percent of Virginia Beach’s restaurant demand is due to visitor spending. When compared with data from this study, which uses the I-O survey method, the use of Wilkerson’s method would likely overestimate the amount and proportion of visitor restaurant spending in Virginia Beach. Virginia Aquarium & Marine Science Center Operating Revenue and Expenses Because of our uncertainty about the nature of the Virginia Aquarium’s operating budgeting process and its degree of independence from the City treasury, for purposes of this study we will treat the Virginia Aquarium as a “quasi-public” enterprise with its own operating budget but with tourist related capital spending on Virginia Aquarium capital projects included as a cost to the City of Virginia Beach (listed under Virginia Beach Capital expenditures in Appendix VII). 2009 Virginia Aquarium tourist related operating revenue is reported by the City as $2,253,326 with 2009 expenditures of $2,892,470. The net of the 2009 operating revenue and expenditures of the Virginia Aquarium would subtract $639,144 from the City’s net direct city revenue return from tourism and would decrease the City’s estimated ratio of net revenue to expenditure to 12.0% in 2009.
APPENDIX II: DETAILED METHODOLOGY: DIRECT IMPACT Overnight Visitor Estimation: Hotels: Where: V1= Hotel Visitors X = room nights P = party size L = length of stay VAR = room occupancy variance adjustment j = month 1 = ith lodging type, for hotels Cottage/Condo: Where: V2= Cottage/Condo Visitors U= rental units D = days in jth month O = occupancy rate 2 = ith lodging type, for cottage/condo Friends and Family: for each f Where: V3=Friends and Family Visitors H = Virginia Beach households Prop = Proportion of Households with visitors (1st)
f = quarter j = Month 3 =ith lodging type, for friends and families Campgrounds: Where: V4= Campground Visitors IC = estimated visitors to an individual campground l = lth campground j = month 4 = ith lodging type, for campgrounds Total Overnight Visitors: Where: V = Total Overnight Visitors i = lodging type Overnight Visitor Spending Estimation: Where: TOVS = Total Overnight Visitor Spending PS = per person per visitor spending i = lodging type j= month
Tax and Fee Revenue Estimation: Sales and License Taxes: Accommodations: Where: AST = Lodging Sales Tax TLS = Total Lodging Sales S = Sandbridge sales TRNT =Total Room Night Taxes = local lodging tax rate for accommodations = cumulative state sales tax rate returned to localities (includes both direct and education functionally dependent on sales). γ= BPOL tax rate λ= Sandbridge special tax district sales tax rate. Restaurants: Where: TVRS = estimated total visitor restaurant spending r = weighted proportion TOVS spent in restaurants and Where: k = off-season proportion restaurant spending t = in-season proportion restaurant spending Where: TXRS = estimated taxable restaurant sales d = tips adjustment μ= state and local sales tax rates adjustment Where: RST = estimated tax from restaurant sales ρ= local restaurant tax rate
Where: TRST = Restaurant Taxes Amusement and Participatory Sports: Where: AT = amusement sales tax TAT = total taxable amusement spending θ= estimated visitor proportion of taxable amusement spending τ= local amusement sales tax rate Where: PT = participatory sports tax TPT = total taxable sports spending ω = estimated visitor proportion of taxable sports spending ψ = local participatory sports tax rate Where: APS = amusement and participatory sports taxes Retail Sales: Where: RETS = estimated retail sales AM = total amusement and participatory sports spending Where: TRETS = retail sales tax σ= Virginia sales tax rate Total Sales and License Taxes: Where: TSLT = estimated total sales and license taxes
Property Taxes: Accommodations: Hotels: Real Property: Where: HPT = hotel property tax AHV = assessed hotel value φ= real property tax rate Personal Property: Where: HPERS = estimated hotel personal property tax PPTR = personal property tax rate D=depreciation Sandbridge: Where: SPV = estimated Sandbridge property tax APV = Sandbridge assessed property value δ = seasonal rental property proportion in Sandbridge Restaurants: Real Estate: Where: RRT = estimated restaurant real estate taxes ARV = Restaurants assessed property value κ= visitor proportion of total restaurant sales Personal Property: Where: RPP = estimated restaurant personal property tax
Retail, Amusement and Participatory Sports: Real Estate: Where: RAP = estimated retail real estate tax Personal Property: Where: RETPP = estimated total retail personal property taxes Total Property Taxes: Where: TPT = estimated total property taxes TOTAL TAX and FEE Revenue Estimation: Where: T = estimated total taxes and fees CVBR = Convention & Visitors Bureau revenue
APPENDIX III: DETAILED METHODOLOGY: INDIRECT AND INDUCED IMPACT While the direct impact of visitor spending is estimated as defined in previous sections, indirect and induced impact estimation requires a different methodology. In this section, attention is focused on the estimation of indirect and induced economic impact of visitors. I. Indirect and Induced Economic Impacts Regional input-output modeling provides the best estimate of indirect and induced economic impacts. Hence, an input-output model is used to estimate these economic impacts. Estimates of indirect and induced economic impacts in this report are based on the Federal Government's Regional Input-Output Model System II (RIMS II). The Bureau of Economic Analysis, U.S. Department of Commerce, provided the RIMS II model for the City of Virginia Beach. This model is based on the national input-output table for 2006, which was regionalized utilizing 2006 data. The national input-output table is made region-specific by the use of a Location Quotient (LQ) approach. The LQ approach is necessary because the inter-industry requirements supplied by a region are likely to be substantially different for the region as compared to the entire nation. The LQ's are used to estimate the extent to which inter-industry requirements are supplied by firms within a particular region. In input-output models, economic sectors within a region are interrelated as other firms in the region purchase some of the output of firms and some output is sold as final demand. This inter-industry relationship may be mathematically presented as: X = AX + Y (1) where: X = Gross sales for each sector; Y = Final demands for each sector; and A = Regional direct coefficient matrix. Equation (1) states that total sales (X) of various sectors in the local economy equal intermediate sales, i.e., sales to other sectors of the economy (AX), and final sales for each sector (Y). Final sales represent mostly demand by consumers but also include demand by local public agencies as well as demand for goods originating from outside the local region.
Equation (1), utilizing the full matrix notation can be written as: • (1’) • The full matrix notion is useful in understanding the basic features of input-output modeling. The aij coefficients of matrix A are interpreted as the dollar value of inputs from sector i necessary to produce one dollar's worth of output for section j. Second, the dimensions of Matrix A, and therefore, of X, are determined by the number of sectors included in the inter-industry matrix. Often, at a regional level, households are included in Matrix A to permit calculation of induced effects caused by changes in household incomes due to direct and indirect economic activity. • The RIMS II Input-Output models used for this study contain 60 sectors that consist of 59 industrial sectors and one household sector. These 60 sectors are described fully in Table III-1. • TABLE III-1 • INDUSTRIAL SECTORS IN RIMS II MODEL • Industrial Sectors • 1. Crop and animal production • 2. Forestry, fishing, and related activities • 3. Oil and gas extraction • 4. Mining, except oil and gas • 5. Support activities for mining • 6. Utilities • 7. Construction • 8. Wood product manufacturing • 9. Nonmetallic mineral product manufacturing • Primary metal product manufacturing • 11. Fabricated metal product manufacturing • 12. Machinery manufacturing • 13. Computer and electric product manufacturing • 14. Electrical equipment and appliance manufacturing • 15. Motor vehicle, body, trailer, and parts manufacturing • 16. Other transportation equipment manufacturing • 17. Furniture and related product manufacturing
18. Miscellaneous manufacturing • Food, beverage, and tobacco product manufacturing • Textile and textile product mills • Apparel, leather, and allied products manufacturing • Paper manufacturing • 23. Printing and other related support activities • 24. Petroleum and coal products manufacturing • 25. Chemical manufacturing • 26. Plastics and rubber products manufacturing • 27. Wholesale Trade • 28. Retail Trade • 29. Air transportation • 30. Rail transportation • 31. Water transportation • 32. Truck transportation • 33. Transit and ground passenger transportation • 34. Pipeline transportation • 35. Other transportation and support activities • 36. Warehousing and storage • 37. Publishing including software • 38. Motion pictures and sound recording industries • 39. Broadcasting and telecommunications • 40. Information and data processing services • 41. Federal Reserve banks, credit intermediation and related activities • 42. Securities, commodity contracts, investments • 43. Insurance carriers and related activities • 44. Funds, trusts, and other financial vehicles • 45. Real Estate • 46. Rental and leasing services and lessors of tangible assets • 47. Professional, scientific, and technical services • 48 .Management of companies and enterprises • 49. Administrative and support services • 50. Waste management and remediation services • 51. Educational services • 52. Ambulatory health care services • 53. Hospitals and nursing and residential care facilities • 54. Social assistance • 55. Performing arts, museums, and related activities • 56. Amusements, gambling, and recreation • 57. Accommodation • 58. Food services and drinking places • 59. Other services • 60. Households
The regional Input-Output model, as described in Equation (1), shows the linkages between various sectors of the economy. This equation must be mathematically manipulated to estimate the indirect and induced economic impacts. Equation (1) can be written as: X - AX = Y or IX AX = Y or (I-A)X = Y where I is an identify matrix or X = (I A) 1 Y Letting B =(I A) 1 X = BY (2) Again using full matrix notation (2’) Matrix B is known as the total requirements matrix. This matrix can provide output requirements from each sector resulting from a one-dollar change in final demand from any one sector. Addition of each column of Matrix B, excluding the household sector, provides the total sales effect associated with a one-dollar change in final demand for that sector. The coefficients associated with household sector are typically termed earning (income) impact. Theoretically, matrix B should consist of 60 rows and 60 columns representing the 60 industrial sectors including the households. However, BEA provides this information, at a regional level, only for 20 industry groups (representing rows of matrix B), and for each of the 60 column industries. Therefore, matrix B, used in this study consists of 20 row industry group and 60 column industries including the household sector. Industry groups comprising 20 row industries and their composition is shown in Table III-2
TABLE III-2 INDUSTRY AGGREGATION IN RIMS II MODEL Industry Groups Agriculture, forestry, fishing, and Hunting 1. Crop and animal production 2. Forestry, fishing, and related activities Mining 3. Oil and gas extraction 4. Mining, except oil and gas 5. Support activities for mining Utilities 6. Utilities Construction 7. Construction Manufacturing 8. Wood product manufacturing 9. Nonmetallic mineral product manufacturing 10. Primary metal product manufacturing 11. Fabricated metal product manufacturing 12. Machinery manufacturing 13. Computer and electric product manufacturing 14. Electrical equipment and appliance manufacturing 15. Motor vehicle, body, trailer, and parts manufacturing 16. Other transportation equipment manufacturing 17. Furniture and related product manufacturing 18. Miscellaneous manufacturing 19. Food, beverage, and tobacco product manufacturing 20. Textile and textile product mills 21. Apparel, leather, and allied products manufacturing 22. Paper manufacturing 23. Printing and other related support activities 24. Petroleum and coal products manufacturing 25. Chemical manufacturing 26. Plastics and rubber products manufacturing
Wholesale Trade 27. Wholesale Trade Retail Trade 28. Retail Trade Transportation and Warehousing 29. Air transportation 30. Rail transportation 31. Water transportation 32. Truck transportation 33. Transit and ground passenger transportation 34. Pipeline transportation 35. Other transportation and support activities 36. Warehousing and storage Information 37. Publishing including software 38. Motion pictures and sound recording industries 39. Broadcasting and telecommunications 40. Information and data processing services Finance and Insurance 41. Federal Reserve banks, credit intermediation and related activities 42. Securities, commodity contracts, investments 43. Insurance carriers and related activities 44. Funds, trusts, and other financial vehicles Real Estate and rental and leasing 45. Real Estate 46. Rental and leasing services and lessors of tangible assets Professional, scientific, and technical services 47. Professional, scientific, and technical services Management of companies and enterprises 48. Management of companies and enterprises Administrative and waste management services 49. Administrative and support services 50. Waste management and remediation services
Educational services 51. Educational services Health care and social assistance 52. Ambulatory health care services 53. Hospitals and nursing and residential care facilities 54. Social assistance Arts, entertainment, and recreation 55. Performing arts, museums, and related activities 56. Amusements, gambling, and recreation Accommodation and food services 57. Accommodation 58. Food services and drinking places Other services 59. Other services Households 60. Households For illustration purposes, the following matrix B shows the effects of one-dollar increases in final demand for both the retail trade and accommodation sectors. (Sector 28 and 57 in the RIMS II model represent the retail trade and accommodation sectors respectively). As final demand for both these sectors increases by one dollar each, total output in the economy increases by $3.491. A one-dollar increase in demand for retail sector requires total sales of all sectors to increase by $1.769. Similarly, total sales increase by $1.722 to satisfy a one-dollar increase in demand for the accommodation sector. Since the above dollar increases in sales represent the total impact, the indirect and induced impact due to one-dollar initial increases in the demand for both the retail and accommodation sectors is $0.769 and $0.722, respectively. A similar interpretation follows for increases in demand for other sectors.
1 2 … 28…….... 57… 60 Total B1 B2 1.769 1.722 B60 The numbers presented within the Matrix B, Bij, are called partial multipliers. For example, B7, 28 and B18, 28 equal $1.056 and $0.033 respectively (Rows 7 and 18 in the RIMS II model represent the retail trade, and accommodation and food services industry groups respectively). These entries respectively represent the total effect of an increase in demand for the retail trade sector for one-dollar on the retail trade, and accommodation and food services industry groups. In other words, to satisfy one dollar of demand in the retail trade sector, retail industry group produces 1.056 dollars worth of output and the accommodation and food services group produces 0.033 dollars worth of output. Likewise, the partial multiplier effects of one-dollar increases in final demand for accommodation on retail and accommodation and food services groups are $0.052 and $1.029. The partial multipliers are often useful in calculating the effects of increases in final demand on specific sectors and/or in the calculation of secondary tax effects if the tax rates on sectors included in the inter-industry matrix are different. The total earning effect of a dollar increase in final demand for both retail trade and accommodation sectors on households are 0.437 and 0.399 respectively. Above discussion applied to estimate one of the effects in the Input Output models, namely the output or spending effect. Same methodology was applied to estimate earning and employment effects. In addition, if households are excluded from the initial matrix A, and the above analysis is performed; we get only the direct and indirect effects. To separate the indirect effects from the induced effects, we used two separate RIMS II models for the City of Virginia Beach. First model included households as a part of the direct requirement matrix. This model generated indirect and induced effects on output (spending), earnings, and employment. Second model excluded households from the direct requirement matrix and it provided indirect effects on output (spending), earning, and employment. Subtraction of indirect effects obtained from the second model from the results of the first model provides estimates of the induced effects.
II. Calculation of Indirect and Induced Economic Impacts on Private Sector This section outlines the algorithms used to calculate the indirect and induced economic impact of visitor expenditures on the private sector industries. Details are shown only for output (spending) impact as the analysis to obtain earning and employment impacts is similar. The following algorithm is used for the calculation of Indirect and Induced Impact: A. Indirect and Induced Spending Impact The direct sales impact is the expenditures of visitors. These expenditures exclude all local and state sales taxes. These expenditures include four categories of spending: Accommodation, Food services, Sports and Amusement, and Retail Sales. Total Spending Impact is estimated from the Input-Output model, in particular the total requirement matrix (B). The algorithm for estimating total spending impact is:
As previously described, the indirect and induced impacts represent the difference between the total sales impact and the direct sales impact. Similar methodology is used to calculate the indirect and induced impacts on earnings and employment but here matrix A will represent earning requirements and employment requirements respectively. This obviously will result in different indirect requirement matrices B for the earning as well as employment impacts. The resulting new matrix B coefficients are then applied to the appropriate direct spending expenditures to obtain indirect and induced impacts on earning and employment. B. Indirect Impact The above algorithms are also used to calculate the indirect impact on output (spending), earnings, and employment. The difference here is that households are excluded from the direct coefficient matrix. Finally, the difference between the indirect and induced impacts obtained earlier and the indirect impacts obtained by excluding the household sector is the induced impact and is calculated as follows: III. Calculation of Total Tourism Economic Impact In order to obtain total tourism economic impact it is necessary to add to the total private sector impacts, obtained above, the direct local sales taxes that accrue to the city as a result of their direct spending in Virginia Beach. This impact should also take into account number of city employees directly associated with the tourism activity and their earnings. Addition of these three categories to the private sector impact yields total tourism economic impact.
APPENDIX IV: TIME SERIES DATA • The availability of more recent and contemporaneous data, as well as incremental methodological improvements in successive years of Virginia Beach economic impact studies, create the opportunity to update past studies relative to a 2005 benchmark in order that inter-year comparisons of visitor spending on latest available data and comparable (apples-to-apples) basis can be undertaken. Accordingly, revisions to previous studies to insure inter-year comparability and uniformity of technique, the outcomes of which are displayed in the accompanying Table IV-1, are detailed as follows. • Census household data, an important component in the estimation of visitors and their spending through the study years, recently have become available with a one-year lag. Therefore the estimation of yearly visitors and their spending data have been updated to reflect the latest available information from the U.S. Census and the American Community Survey. • Estimates of visitors staying in hotels in 2000 and 2001 were originally based on occupancy study (survey data) while those for 2002 to 2004 were based on hotel room nights from the Tourism Indicators Report. More accurate disaggregated tax data are now available and hotel room nights have been revised accordingly. • All data are adjusted to conform to the U. S. Department of Commerce BEA Satellite Account definitions of the tourist industry. However, this study estimates only visitor spending from the in-flow of visitors from outside of 50 miles and those staying in hotels. • House/Condo rentals as well as hotels are adjusted for previously not available or updated property tax data. • Hotel visitors have been adjusted to reflect the statistical variance in multiple party room reservations. • Visitor spending data have been adjusted to reflect the effect of potential survey over-estimation of taxable sales or for the potential overlap created by U.S. Department of Commerce NAICS definitions. • A new mathematical model has been developed to more closely represent the effect of the Commonwealth’s distribution of sales tax revenue created by visitor spending.
Table IV-1: BENCHMARKED TIME SERIES ESTIMATES OF VISITOR SPENDING, CITY REVENUE, CITY EXPENDITURES AND OVERNIGHT VISITORS IN VIRGINIA BEACH* Year Visitor City City Overnight Spending Revenue Expenditures Visitors (Millions $) (Millions $) (Millions $) (Millions) 2000 $647.6 $50.5 $34.3 2.5 2001 $685.0 $53.6 $32.3 2.6 2002 $726.9 $62.3 $32.8 2.6 2003 $756.8 $65.6 $39.8 2.4 2004 $791.6 $68.8 $47.4 2.5 2005 $828.0 $70.5 $60.9 2.7 2006 $856.9 $73.2 $64.4 2.7 2007 $889.9 $78.4 $66.6 2.7 2008 $864.3 $78.4 $68.4 2.5 2009 $815.7 $77.9 $68.7 2.5 *Updated to include the most recently available data and method as described on the previous page. Benchmark year is 2005.