Download
1 / 10
100 likes | 273 Views
CHARACTERIZATION OF DEFECTS WITH SMALL CAPTURE CROSS-SECTION IN DETECTOR-GRADE SILICON BY DLTS and LAPLACE-DLTS L.F. Makarenko*, J. Evans-Freeman**, V.P. Markevich***, S.B. Lastovski**** * Belarusian State University, Minsk, Belarus

E N D
CHARACTERIZATION OF DEFECTS WITH SMALL CAPTURE CROSS-SECTION IN DETECTOR-GRADE SILICON BY DLTS and LAPLACE-DLTS L.F. Makarenko*, J. Evans-Freeman**, V.P. Markevich***, S.B. Lastovski**** * Belarusian State University, Minsk, Belarus **Materials and Engineering Research Institute, Sheffield Hallam University, Sheffield, UK ***School of Electrical and Electronic Engineering, University of Manchester, Manchester, UK ****Institute of Solid State and Semiconductor Physics, Minsk, Belarus
The correct characterization of defects in Si detectors is very important to understand mechanisms of radiation damage and to improve further radiation hardness of 'detector-grade' silicon. Very often the interpretation of impurity-defect reactions is based on appropriate identification of traps observed by DLTS. To identify them several features have been taken into account. First of all they are trap parameters determined from temperature dependence of emission rate. Due to instrumentation limitations, rate windows in the range wr=10-1000 s-1 are used as a rule for defect studies and their identification using DLTS method. For conventionally doped semiconductors when we determine temperature dependence of emission rate for a trap, Fermi level is far above of the trap occupancy level. For detector grade silicon this condition can be violated for traps with small capture cross section. This paper shows that it may lead to incorrect determination of trap parameters using conventional DLTS and Laplace-DLTS method is preferable for such traps. Several examples are considered. One of them is Ec-0.24 eV trap related to divacancy. Other examples are traps formed under annealing of irradiated n-Si detectors (Ec-0.36 eV etc).
Fig.1. DLTS spectra for Si detectors (=4 kcm) irradiated with electrons (E=3.5 MeV) measured with standard rate windows (a) and with rate windows wr1000 s-1 for E024 peak only (b). Rate windows are 50 (1), 200 (2) and 1000 (3) s-1 (a) and 20 (1), 50 (2), 400 (3), 1000 (4), 2000 (5) and 5000 (6) s-1.
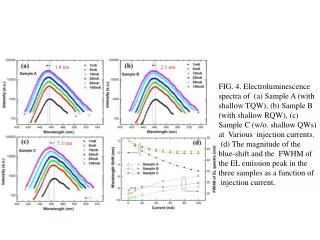
Fig.2. Arrhenius data for VV= emission rate determined experimentally from Laplace data (black circles) and from DLTS data (blue down triangles). The line shows emission rate calculated from data of [Hallen, 1996]. Fig.3. Laplace-DLTS spectra obtained at different temperatures for the same sample.
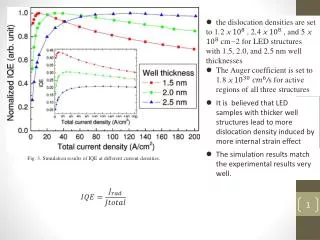
While analyzing DLTS signal we have to use more extended equation which takes into account a defect occupation function. (1) where . (2a) If the filling pulse is long enough (2b) where f(T) is the occupation function of a defect in semiconductor. The conventional forms for it are . (3) Fig.4. Simulation of the shift for DLTS peak maximum when its appearance is coincides with the temperature interval where the trap occupancy is changed due to Fermi level crossing of the trap occupancy level. Simulation parameters are E=0.25 eV, E1=Ec-0.235 eV, n=1.11012 cm-3, wr=5000 s-1.
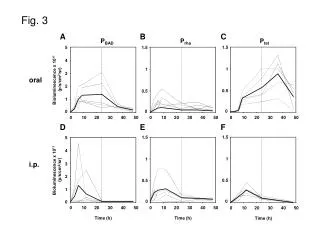
Fig.5. Dependence of DLTS signal amplitude on temperature of DLTS peak appearance for detectors with different doping.
Usually it takes place a relation for majority of traps (for conventional traps) observed in different semiconductors. Due to instrumentation restrictions (limitations), rate windows in the range wr=10-1000 s-1 are used as a rule for defect studies and identification using DLTS method. Let us choose the higher boundary value of wr=1000 s-1 as a reference one and determine an electron trap with or less as a trap with a low capture cross-section. This can be used further as a practical criterion for small σ centers Fig.5. The difference between semiconductors with standard doping and ‘detector grade‘ material.
Table 1. Parameters of dominant traps formed in silicon detector structures after electron irradiation and annealing at different temperatures
Fig.6. DLTS spectra for standard FZ diode (CA-sample) after isochronal annealing at temperature 350 C. Measurement settings were ew = 19 s-1, bias –5 0 V, and pulse duration (tp): 100 ms , 10 ms, 1 ms, 0.1 ms. Fig.7. DLTS spectra of E8 peak (Ec-0.36 eV) in Si detectors irradiated with electrons (E=3.5 MeV) and annealed at 350 C. Rate windows are from 3.8 to 3800 s-1.
Conclusions It has been observed an unusual behavior of several DLTS peaks in high resistivity silicon diodes irradiated with electrons. This behavior was explained as due to an effect of Fermi level position on DLTS signal amplitude. It is suggested to use temperature dependence of DLTS or Laplace-DLTS peak amplitude to determine occupancy levels for defects in semiconductors Acknowledgement One of us (L.F.M.) is grateful for the financial support of the Royal Society, the United Kingdom.


![Fig. 3. Train of pulses with two different periods [3].](https://cdn1.slideserve.com/3253865/slide1-dt.jpg)