Download
1 / 24
240 likes | 393 Views
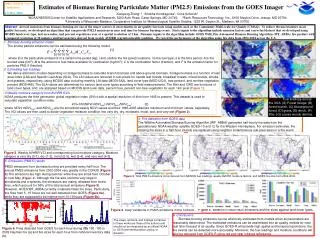
Cross-border Transport of Fine Particulate Matter into Texas from Agricultural Burning. Presented at the 2004 Models-3 Conference Chapel Hill, NC October 18-20, 2004. Myoungwoo Kim, Ieesuck Jung, and Kuruvilla John Department of Environmental and Civil Engineering

E N D
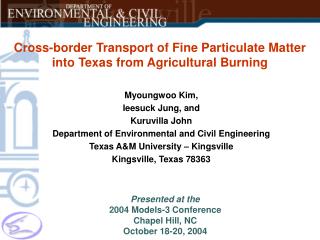
Cross-border Transport of Fine Particulate Matter into Texas from Agricultural Burning Presented at the 2004 Models-3 Conference Chapel Hill, NC October 18-20, 2004 Myoungwoo Kim, Ieesuck Jung, and Kuruvilla John Department of Environmental and Civil Engineering Texas A&M University – Kingsville Kingsville, Texas 78363
Introduction • Corpus Christi, Texas is a major petrochemical center and its port is the fifth busiest one in the United States in terms of annual tonnage. • Corpus Christi with a population of about 300,000 is the sixth largest Consolidated Metropolitan Statistical Area (CMSA) in Texas. • It is currently in attainment of the NAAQS for all criteria pollutants. • However, the monitored air quality trend indicates that the city could potentially be in danger of violating the annual average NAAQS for fine particulate matter in the near future. • PM2.5 level of Corpus Christi area is influenced by atypical episodes affected by the long-range transport of continental haze and smoke events attributed to agricultural burns in Texas and beyond. • Recent air pollution episodes such as the May 2-19, 2003 smoke event and the Sep 11-14, 2002 continental haze events significantly contributed to elevated levels of PM2.5. • In this study, potential source contribution function (PSCF) and the UNMIX receptor model were used to obtain source apportionment details and to identify source-receptor relationship affecting the Corpus Christi urban area.
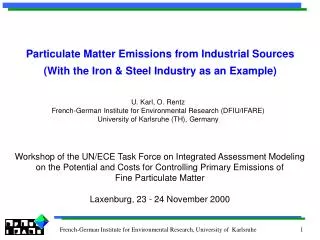
Annual PM2.5 levels in Corpus Christi, Texas The annual average concentration of the fine particles measured using TEOMs operated by TCEQ showed an increase of 10.6% between 2001 and 2002. The increase between 2002 and 2003 was approx. 17.3 %.
Sampling and Data • The study period: 2001-2003. • Continuous PM2.5 data from TEOM located at the CAMS04 site in Corpus Christi. • FRM filter mass and fifty-three speciation elements measured at CAMS199 by the Texas Commission on Environmental Quality (TCEQ) - once every six days. • The chemical speciation analysis: gravimetric, energy dispersive XRF, ion chromatography and thermal-optical methods. • As, Br, Cr, Cu, Fe, Pb, Mn, Mo, Ni, Sn, V, Si, S, Ta, K, K+, NH4+, Na,Na+, EC, Non Volatile Nitrates (NvN), OCX (Non Organic Carbonate Carbon) and OC.
South Texas PM2.5 level during smoke event Source: TCEQ
Backward Trajectory Calculations • NOAA’s Air Resources Laboratory developed and used HYSPLIT4 for air parcel trajectory computations. • HYSPLIT4 trajectory model was used to effectively integrate winds in the transport layer over time, distance, and source regions. • 2-day back trajectories were drawn using wind fields from datasets of: - Eta Data Assimilation System (EDAS): 2003 - Model start height: 500 m, middle of mixed layer - Model start times: UTC hour of observed PM2.5 concentrations • The region covered by the trajectories was divided into 1583 grid cells of 11 latitude and longitude
Potential Source Contribution Function (PSCF) • Hopke et al. developed and used the PSCF for air pollution source apportionment and source-receptor relationship studies. • If a backward trajectory endpoint lies in the ijth cell, the air parcel assumes to collect PM emitted in the cell and transports along the trajectory to the monitoring site. • PSCFij is the conditional probability that an air parcel that passed through the ijth cell has a high concentration upon arrival at the monitoring site nij : total number of end points that fall in the ijth cell mij : number of end points that exceeded the threshold criterion (in this study, average concentration of PM was used for the threshold criterion)
Average nij 43.2 1.0 Maximum nij 329 0.7 Standard Deviation 48.7 0.5 0.2 Downweight Functions • Small values of nij produce high PSCF values with high uncertainties. • To minimize the artifacts, PSCF values were downweighted with weight function (W) when nij was less than the average nij.
Potential Source Contribution Function (PSCF) • PSCF describes the spatial distribution of probable geographical source locations. • Grid cells which have high PSCF values are the potential source area whose emissions can contribute to the levels observed at the receptor (monitoring) site. • For secondary pollutants, the high PSCF area may also include areas where secondary formation is enhanced.
Source Apportionment (UNMIX) • R. C. Henry developed the multivariate receptor model, UNMIX, for source apportionment studies. • The UNMIX model was applied to a set of air quality compositional data to identify the number, composition, and contribution of the various sources of air pollution. • The data used in this study included concentrations of As, Fe, Si, S, K, NH4+, Na+, OC, EC, Non Volatile Nitrates (NvN), OCX (Non Organic Carbonate Carbon), and SO4 • UNMIX was then applied to a set of PM2.5 and species data with and without data collected during the smoke events to identify unique source types associated with this event.
48-hours Backward Trajectory Calculations Corpus Christi
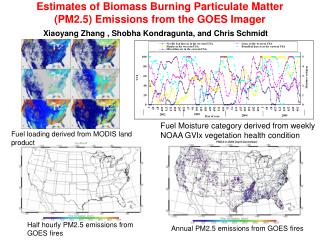
Analysis of the 2003 Agricultural Burning Season Corpus Christi May 2-19, 2003: Every spring, at the end of the tropical dry season, agricultural burning and wildfires produce large amounts of smoke in southeastern Mexico and Central America. The fires usually begin in March and by late May or early June the smoke production diminishes as the rainy season begins. The peak of the burning is usually in late April and early May. Persistent southeasterly winds carry the resulting smoke to Texas, most frequently in April and May. MODIS source: University of Wisconsin (SSEC) and Texas Commission on Environmental Quality
Three-dimensional transport of PM2.5 Corpus Christi • PSCF analysis was also applied to altitude and longitude to evaluate three-dimensional transport of the smoke event. • Starting height of backward trajectory was 500m. • It was noted that air parcels arriving in the Corpus Christi area at the 500m level were transported from the source region and mixed within the PBL of approximately 1 km.
Source Apportionment (UNMIX) The six source model output revealed that crustal soil, nitrates, salt from sea spray, potassium, vehicular sources and sulfates were the major factors contributing to the total ambient PM2.5 mass in the Corpus Christi urban airshed. • The UNMIX model was run with and without the smoke episode data and the primary difference was noted in the apportionment of potassium (K) in the six-source model. K is a strong indicator of burning sources and is linked to agricultural burns in the region. • Sulfate indicating industries accounted for 44% of the total variance.
Analysis of the Sept. 11-14, 2002 Haze Event Sept. 11-14, 2002: Increasing levels of haze and high ozone began arriving in East and Central Texas. The haze and air pollution had accumulated for several days in a stagnant air mass centered near the junction of the lower Ohio River Valley and the middle Mississippi River Valley. A weak cool front then pushed the hazy air mass south-southwest into South Texas. Corpus Christi MODIS source: University of Wisconsin (SSEC) and Texas Commission on Environmental Quality
Summary Results • The PM2.5 level is influenced by long-range transport of haze and smoke during episodes such as May 2-19, 2003. These events significantly elevated the annual PM2.5 levels observed in the Corpus Christi airshed. • PSCF and UNMIX receptor models were applied to understand the source-receptor relationship and identify various source types affecting the urban area. • PSCF analysis identified southern Mexico and Central America as possible source areas affecting the Corpus Christi area during the May 2-19, 2003 smoke event. • UNMIX receptor modeling suggested that agricultural burning as one of the primary sources of PM during the smoke episode.
Acknowledgements The authors are grateful to Texas Commission on Environmental Quality (TCEQ) – Austin Office for providing access to the air quality data and to the National Oceanic and Atmospheric Administration’s (NOAA) Air Resources Laboratory for the use of the HYSPLIT4 Model.
References • Henry, R.C., Lewis, C.W., Hopke, P.K., Williamson, H.J., Atmospheric Environment1984 18, 1507–1515. • Gordon, G.E., Environmental Science and Technology1988 22, 1132–1142 • Philip K. Hopke J. Chemometrics2003, 17, 255-265. • Lin, C. J.; Cheng, M. D.; Schroeder, W.H. Atm. Env.2001, 35, 1141-1154. • Pollissar, A.V.; Hopke, P.K.; Paatero, P.; Kaufmann, Y.J.; Hall, D.K.; Bodhaine, B.A.; Dutton, E.G.; Harris, J.M. Atm. Env.1999, 33, 2441-2458. • Draxler, R.R.; Hess, G.D. Description of the HYSPLIT4 Modeling System, NOAA Tech Memo: 1997; ERL ARL-224. • Lucey, D.; Hakjiiski, L.; Hopke, P.K.; Scudlark, J.R.; Church, T. Atm. Env.2001, 35, 3979-3986. • Zeng, Y.; Hopke, P.K. Atm. Env.1989, 23, 1499-1509.