Download

1 / 15
0 likes | 11 Views
Course lectures cover the physics of various energy sources, including renewable sources like hydropower, wind power, and nuclear power. The impact of energy consumption on society, historical advancements in energy harnessing, global energy trends, and the greenhouse effect leading to global warming are discussed. Key topics include the depletion of fossil fuel reserves, CO2 emissions, and the correlation between energy consumption and GDP per capita.

E N D
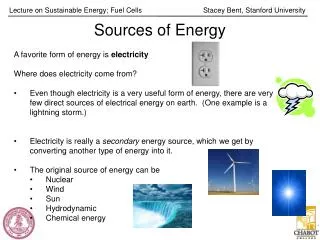
PHYSICS OF ENERGY SOURCES Dr J N Jackson and Dr J Coleman Oliver Lodge Laboratory jnj@hep.ph.liv.ac.uk, coleman@hep.ph.liv.ac.uk 8/27/2024 Lecture 1 1
TOPICS • Introduction • Renewable sources – Basic physics required, thermodynamics, fluid dynamics – Hydropower, wave power and tidal power – Wind power – Solar power – Biomass • Nuclear Power – Basics of nuclear physics – Principles, theory and operations of fission reactors – Progress with nuclear fusion – Radiation issues • Energy and society 8/27/2024 Lecture 1 2
RECOMMENDED TEXTS 1. Energy Science, principles, technologies and impact Andrews and Jelley, Oxford University Press, ISBN 978-0-19-928112-1 2. Nuclear Physics, Principles and Applications Lilley, Wiley ISBN 0-471-97936-8 FURTHER READING 1. Physics of the Environment Brinkman, Imperial College Press, ISBN 9-781848-161801 2. The Elements of Nuclear Power Bennett and Thompson, Longman 8/27/2024 Lecture 1 3
INTRODUCTION • Historically mankind has gradually made increasing use of natural resources – Starting with the invention of fire – In the last two centuries we have learned how to convert heat into electricity • In a relatively short time we have significantly depleted the fossil fuel reserves of the planet • The resulting emission of CO2and other products of combustion is now having a noticeable effect on the climate • The world population and the demand for energy are both increasing • This course will examine the physical principles leading to the technological options currently open to us in seeking a solution to these problems 8/27/2024 Lecture 1 4
SOME HISTORY Harnessing energy has been a continuing challenge leading to advances in scientific understanding and engineering Water devices – Archimedes screw, water wheels , Fourneyron Turbine Steam engines – Hero’s engine, Papin, Savery(1690), Newcomen, Watt(1769), Parsons Turbine(1884) • • • – Thermodynamics and the Carnot cycle(1824) Electricity – Discoveries of Oersted, Ampere, Faraday – 1stPower station 1881 , DC, Edison – AC system, Westinghouse – 1sthydroelectric station, Niagara, 1895 Nuclear Power from late1950s • • 8/27/2024 Lecture 1 5
GLOBAL ENERGY TRENDS • There is a strong correlation between standard of living, as measured by GDP / capita and energy consumption per capita – A large spread between different highly developed countries • Scope for reducing consumption via improving efficiency and changing lifestyle 8/27/2024 Lecture 1 6
• It is natural for the less well developed countries to increase their GDP and population thus increasing energy consumption • The population in developed countries will stay ~ constant and hopefully efficiencies will be achieved Population (x109) Power per capita (kW) Total power consumption(TW) 1992 Developed countries 1.2 7.5 9.0 Less developed countries 4.1 1.1 4.5 Total 5.3 13.5 2025 Developed countries 1.4 3.8 5.3 Less developed countries 6.8 2.2 15.0 Total 8.2 20.3 8/27/2024 Lecture 1 7
• World energy consumption 1970 – 2020 • Oil, coal and gas provided 86% of all energy consumption in 2003 • Oil, gas and coal resources expected to last for 40/70/250 years respectively 8/27/2024 Lecture 1 8
• Primary fuel shares (% of total) assuming no change in reliance on fossil fuels 2000 2010 2020 Oil 39.2 36.4 34.4 Gas 23.0 23.8 25.5 Coal 23.8 25.3 26.1 Nuclear 6.5 5.7 5.4 Renewables 7.6 8.9 8.7 8/27/2024 Lecture 1 9
GLOBAL WARMING THE GREENHOUSE EFFECT • The main greenhouse gases are water vapour and CO2which absorb infrared radiation • If the atmosphere was transparent to all radiations the Sun would heat the surface until it reached -19oC at which point the incoming and outgoing radiation rates would balance • The atmosphere is mainly transparent to the Sun’s radiation which is mainly in the visible region but will absorb infrared • The energy radiated back from the surface at near room temperature is mainly infrared. • The atmosphere absorbs infrared and heats up • It then radiates both out into space and also back to earth • Hence the surface temperature rises by about 35oC until the incoming and outgoing radiation are in equilibrium 8/27/2024 Lecture 1 10
• The burning of fossil fuels has added to the CO2in the atmosphere Growth in CO2emission by fuel type Source CO2emission kg per kWh 1.5 CO2 emissions (life cycle analysis) Wood (without replanting) Coal 0.8 – 1.05 Natural gas (combined cycle) 0.43 Nuclear power 0.006 Photovoltaic 0.06 – 0.15 Hydroelectric 0.004 Wind power 0.003 – 0.022 8/27/2024 Lecture 1 11
• Over the 20thcentury the average global temperature rose by 0.6 ± 0.2oC and the prediction of the IPCC is that there will be a rise of 1.4 - 5.8oC between 1990 and 2100 if nothing is done • The steep rise since 1970 is termed Global Warming and is thought to be due to ANTHROPOGENIC emissions (CO2, methane, CFCs etc) 8/27/2024 Lecture 1 12
• Global warming is expected to become more pronounced in the coming decades • The effect on weather systems, ocean currents and sea levels could be devastating – Hence the need for international agreements to: • Increase the efficiency of energy use • Reduce dependence of fossil fuels • Develop schemes to reduce CO2emission from fossil fuels • Develop alternative sources of power • In this course we will review the various technologies for power production 8/27/2024 Lecture 1 13
NON SI UNITS Quantity Unit Definition SI Equivalent Heat 1 g H2O by 1oC Heat 1 lb H2O by 1oF 1.055 kJ Energy calorie 4.2 J Energy Btu or 0.293 kWh Energy barrel 42 US gallons, 0.136 tonnes 159 litres Fuel equivalence 1 tonne oil 1.5 tonnes hard coal 3 tonnes lignite 12000 kW h Power 1 horsepower 550 ft lb per second 0.746 kW 8/27/2024 Lecture 1 14
EXAMPLE Assuming that the volumes of the Greenland and Antarctic ice caps are 2.85 106km3and 2.57 107km3respectively and that the radius of the Earth is 6378 km with 70% of the surface covered by sea, estimate the rise in sea level if both icecaps melt completely Total volume of ice V = (2.85 106+ 2.57 107)km3= 28.6 1015 m3 Surface area = 0.7 x 4 p r2= 358 1012 m2 Ignoring the difference in densities of ice and water for this estimate the rise in sea level would be h = 28.6 1015/ 358 1012 ≈ 80 m 8/27/2024 Lecture 1 15