Download
1 / 27
270 likes | 290 Views
This study examines the prevalence of overweight and obesity in 2-6 year old Italian children and explores the relationship between adiposity, diet, and other factors. It highlights the importance of early intervention to prevent childhood obesity.

E N D
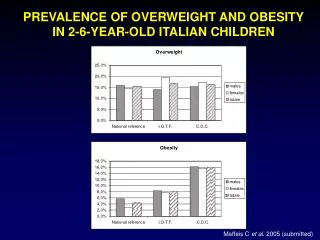
PREVALENCE OF OVERWEIGHT AND OBESITYIN 2-6-YEAR-OLD ITALIAN CHILDREN Maffeis C et al. 2005 (submitted)
first year adiposity rebound pregnancy puberty 35 30 25 20 15 10 5 0 fat mass (%) -0.8 -0.2 -0.1 0 2 4 6 8 10 12 14 16 18 Age (years) male female Dietz WH Am J Clin Nutr 1994
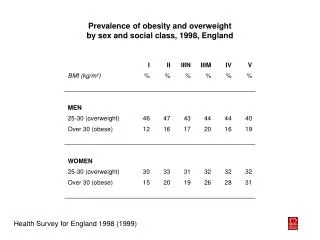
birth weight and type 2 diabetes in Pima Indian children and young adults age group (years) 10 - 14 15 - 19 20 - 29 5 - 9 25 20 15 Prevalence (%) 10 birth weight (kg) < 2.5 2.5 - 3.5 5 3.5 - 4.5 > 4.5 0 (Mantel-Haenszel X2 test, controlled for age and sex) Dabelea D et al. Diab Care 1999;22:944
energy requirements in breast fed infants compared with FAO recommendations Age (days) Weight (kg) TDEE (kJ/day) Metabolizable EI (kJ/kg/d) Diff. From FAO (%) reference Lucas et al. Wells & Davies Butte et al. Salazar et al. FAO/WHO/UNU 35 36 32 34 4.5 4.5 4.7 4.5 1280 1270 1212 1205 17 13 21 19 402 421 383 391 485
energy intake 4000 energy (kcal/d) 3500 3000 2500 1900 1920 1940 1960 1980 2000 year Bray G, 2004
variazioni della spesa energetica per l’accrescimento (EEG) espressa in rapporto alla spesa energetica totale (TEE), in funzione dell’età 25 20 maschi 15 femmine EEG/TEE (%) 10 5 0 0 5 10 15 20 età (anni)
rapid weight gain during infancy and obesity in young adulthood in a cohort of African Americans Adjusted analysis obese in young adulthood: rapid weight gain category (0 to 4 months): sex (F) birth weight (kg) gestational age (wk) firstborn status birth year maternal BMI (kg/m2) maternal age (y) maternal education (y) OR 95% CI P 5.22 6.57 17.6 0.77 2.33 3.43 1.2 0.93 0.97 155, 17.6 1.83,23.5 2.22,140 0.35,1.68 0.54,10.2 1.01,11.7 1.04,1.39 0.83,1.03 0.69,1.37 0.008 0.004 0.007 0.5 0.3 0.049 0.013 0.16 0.9 Stettler N, et al. Am J Clin Nutr 2003
catch-up growth in childhood and death from coronary heart disease: longitudinal study ponderal Index (kg/m2)* body mass index at the age of 11 yrs < 15.5 -16.5 -17.5 >17.5 5.3 3.3 3.7 < 25 2.7 2.7 3.2 4.0 - 27 1.5 3.2 1.6 1.8 - 29 2.2 1.9 1.7 1.5 > 29 1.0 * adjusted for length of gestation Erikson JG, et al. BMJ 1999;318:427-31
The infant: a model of physiological overfeeding human milk: fat = > 50% of EI cho = < 40% of EI 7,000 25 1,750 fat mass (%) fat mass (g) weight (g) 3,500 14 500 0 2 4 age (months)
protein requirements during the first year of file 2.4 protein intake (g/kg/d) estimated protein intake from human milk 1.8 1.2 estimated protein needs 0.6 0 4 8 12 age (months) Dupon C Am J Clin Nutr 2003
basis of weaning recommendations months 0 3 6 9 12 15 18 21 24 breast milk staple weaning food and other grains soft fruits and vegatables meats and other protein rich foods transitional period given regularly
NUTRIENT INTAKE IN ITALIAN CHILDREN 80 (%) 60 40 LARN 20 LARN LARN 0 FAT CARBOHYDRATE PROTEIN
covert manipulation of dietary fat and energy density: effect on substrate flux and food intake in men eating ad libitum fat balance energy balance MJ MJ 20 20 high fat medium fat 15 15 low fat 10 10 5 5 0 0 - 5 - 5 - 10 - 10 0 1 2 3 0 1 2 3 4 5 6 7 4 5 6 7 time (days) time (days) Stubb RJ, et al. AJCN 1995; 62:316-29.
fatty food more palatable high energy density less satiating 50 25 0 fat mass (%) r = 0.28 P< 0.01 10 30 50 Klesges RC et al. AJCN ‘94 lipid intake (% of energy intake) Gazzaniga JM, et al.AJCN ‘93 Maffeis C et al. Int J Obes ‘96
THE SWEETING OF THE WORLD’S DIET gross national products per capita/grouping of countries: fiftiles 600 III IV V I II 1978 -1994 adolescents soft drinks: + 70% milk: -65% 400 kcal/capita/day added sugar 200 0 1962 2000 Popkin &Nielsen Obes Res 2004
Mean differences in lunch intake after different breakfasts, compared with lunch intake after habitual breakfast Warren, J. M. et al. Pediatrics 2003;112:e414
livelli di attività fisica durante l’adolescenza possono influenzare significativamente il BMI e l’adiposità nell’età adulta. Kimm SYS, et al Lancet, 2005
G G FFA FFA O2 CO2 G L Y C O L Y S I S G L Y C O G E N lipid store KC Acetyl CoA Acetyl CoA ox H+ ADP + Pi ATP
pre-pubertal physical activity of boys and girls 700 activity related energy expenditure (kcal/day) males 500 females 300 age (years) 4 6 8 10 9 activity (h/week) 6 3 age (years) Goran MI, et al. Pediatrics 1998;101:887 4 6 8 10
TV viewing, TV in the bedroom and overweight risk For each additional hour per day of TV/video viewed (adjusted for age, sex, parental education, race) the odds ratio of children having a BMI > 85th percentile was 1.06. Almost 40% of children had a TV set in their bedroom (OR 1.31) Dennison BA, et al.Pediatrics 2002
INFLUENCE OF CHANGES IN SEDENTARY BEHAVIOR ON ENERGY AND MACRONUTRIENT INTAKE IN YOUTH 150 BOYS GIRLS 75 changes in targeted sedentary behavior from baseline (min/day) INCREASE PHASE DECREASE PHASE - 75 - 150 Epstein LH, et al. AJCN 2005;81:361-6
percentage distribution of the energy intake among the different meals 40 30 20 10 0 Morning snack Afternoon snack Night snack Breakfast Lunch Dinner Maffeis C, et al. Int J Obes 1999
conclusioni • gli eccessi alimentari sono numericamente più rilevanti • delle carenze. • l’energia richiesta per la crescita è molto contenuta (2 - 8 aa). • bevande zuccherate e alimenti ad alta densità calorica sono • fattori di rischio di obesità • è consigliabile moderare gli apporti energetici del pasto serale • La limitazione dell’esposizione al video e la regolare pratica • di uno sport sono importanti quanto un’alimentazione • equilibrata
ENERGY-DENSE SNACK (EDS) FOOD INTAKE IN ADOLESCENCE: LONGITUDINAL RELATIONSHIP TO WEIGHT AND FATNESS • relationship between total EDS food consumption and • SDS BMI or %BF: no significant • relationship between soda consumption and SDS BMI • or %BF: significant • relationship between EDS food consumption and • TV viewing: significant Phillips SM et al. Obes Res 2004;12:461-72
SNACK FOOD INTAKE DOES NOT PREDICT WEIGHT CHANGE AMONG CHILDREN AND ADOLESCENTS • prospective study of 8203 girls and 6774 boys, • 9-14 y of age in 1996. • boys consumed more snack foods than girls • after controlling for Tanner stage, age, height change, • activity, and inactivity, there was no relationship between • intake of snack foods and subsequent changes in SDS BMI. Field AE et al. Int J Obes 2004;28:10:1210