Download
1 / 43
450 likes | 721 Views
Project Management in Practice. Initiate. Plan. Execute. Monitor And Control. Close. Monitoring & Controlling the Project. Outline:. Overview Earned value analysis Project control / tracking techniques Scope creep and change control

E N D
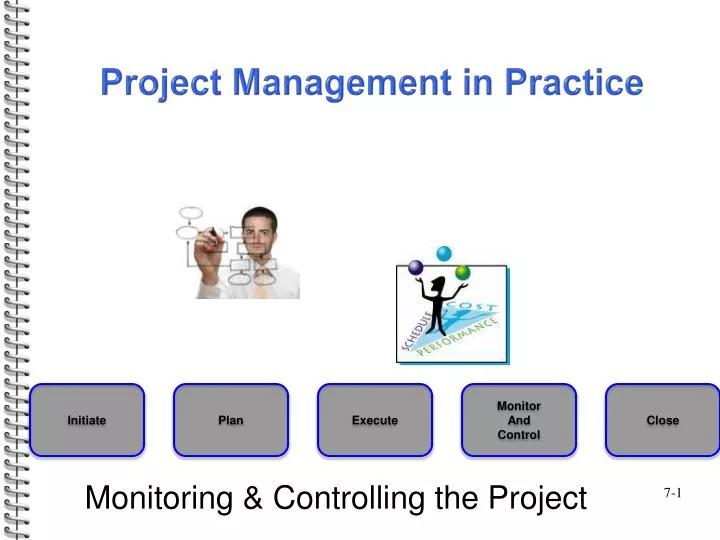
Project Management in Practice Initiate Plan Execute Monitor And Control Close Monitoring & Controlling the Project
Outline: • Overview • Earned value analysis • Project control / tracking techniques • Scope creep and change control • Quality / collection and presentation of project data. Homework: 25, 26, 27, 28 #27 end of 6th week = MSP date 2/10/01 (end of 6th week), do not compute critical ratio use the default 5-day work week use start date 1/1/01 #28 Repeat problem 27 using MSP
Overview: Monitoring Project Plan Control
Schedule Variance &Cost/Spend Variance: EV PV PV AC EV AC
Performance Cost Sched. Cost schedule plan (baseline) Dollars ACWP Cost variance Actual cost BCWS Schedule variance BCWP Value completed (Earned Value) Now Time Earned Value Chart 1 bad bad
Performance Cost Sched. ACWP Dollars BCWS baseline BCWP =EV Now Time Earned Value Chart 2 bad good
Performance Cost Sched. Dollars BCWP = EV BCWS baseline ACWP Now Time Earned Value Chart 3 good good
Performance Cost Sched. Dollars BCWS baseline ACWP BCWP = EV Now Time Earned Value Chart 4 bad bad
Performance Cost Sched. Dollars BCWS baseline BCWP = EV ACWP Now Time Earned Value Chart 5 good bad
Performance Cost Sched. Dollars BCWS baseline BCWP =EV ACWP Now Time Earned Value Chart 6 good good
Earned Value Analysis • Earned Value Analysis compares the current project status with the original (baseline) plan. • It computes several performance metrics for individual activities and for the entire project. • It focuses on cost and schedule performance • It’s a useful tool/input for project control. • Popular project management software computes these metrics. • Project EV is calculated by summing up the individual task EV’s.
Task Earned Value • Expert estimated value of work performed to date, if available. • There are a variety of rules (see page 248). • Work off budget / schedule values, if available. EV = BAC X (portion of work completed) EV = BAC X (actual work completed / total amount of work)
Expert believes value of work performed to date is $120,000. • Task is complete, expected to cost $1,500 (budgeted), best estimate is the task is 2/3 finished. • Day 50 of 100 day, $100,000 budgeted task, manager estimated value of work performed is $40,000. • Project X is at the end of its 5th week. Activity D is 30% complete. Activity D budgeted cost is $1000. Task Earned Value - Examples 3 8 D5 3
Task Planned Value/Cost, PV Planned cost of work on a task or project up to a given point in time. PV = BAC X (portion of time that has elapsed) PV = BAC X (time passed / total time scheduled) • Budgeted / scheduled amount, to date. • Determined from the baseline plan or budget. • Works off budgeted cost numbers. • BCWS.
Task Planned Value/Cost, PVExamples • Activity was scheduled to have spent $100,000 at this point in the plan / budget. • Work on a project task was expected to cost $1500 and the workers were originally scheduled to have the task compete today. • Work on a project task is uniformly distributed, total task budget is $2000. The task is scheduled to last 8 weeks, the current time is end of week 5. Task is scheduled to begin end of week 2.
Variances / Indicies • Cost/Spending Variance • earned value (EV) – actual cost (AC) • Schedule Variance • earned value (EV) – planned cost (PV) • CPI (Cost Performance Index) • earned value (EV)/actual cost (AC) • SPI (Schedule Performance Index) • earned value (EV)/planned cost (PV)
Example Day 75 of a 75 day task, Task “data conversion of payables for external vendors”. Task planned cost total on day 75, $100,000 ($100,000 = PV). Actual spend to date, $90,000. Best estimate 50% complete. Earned Value (EV) =0.50 X $100,000 = $50,000. Cost/spending variance = EV – AC = $50,000 - $90,000 = - $40,000. Schedule variance = EV – PV = $50,000 - $100,000 = - $50,000. CPI = EV/AC = 50/90 = 0.56 Cost Performance Index SPI = EV/PV = 50/100 = 0.50 Schedule Performance Index (we are worse on schedule than cost) ETC = (BAC – EV) / CPI = (100,000 – 50,000) / .56 = $90,000. EAC = ETC + AC = $90,000 + $90,000 = $180,000. ETC = Estimated cost To Completion EAC = Estimated total cost At Completion BAC = Budget At Completion AC = Actual Cost to date
Current date = end of day 18 ExampleAON Diagram: 8 14 b 0 8 14 17 a f 8 19 e 19 20 g 0 4 4 13 c d
Gantt Chart: Task e Task e = 11 days, current date is end of day 18 At end of day 18, we are scheduled/planned to be 10/11 complete. This is used in the PV computation.
Excel Given & Solution: Break task into 11 (its duration) parts. End of day 18 we are 10/11 finished. notice
Current Date Line Beg of day 2/1 MSP Notes: Double Click Put end of day date here for MSP calculations End of day 2/1 Current Date Line Used in MSP Calculations
MSP Enter Project Basic Information Start Here Enter activity names, predecessors, durations. Start of the project is 01/15/2001. • Steps: • Enter tasks and durations • Project Information • Start date: 1/15/01 • 3. Project, Change Working Time • Work weeks, Details • to 7-day work week • set day(s) to these specific working times • 8am to 12pm and 1pm to 5pm • 4. Enter Predecessors
MSP View the Network Diagram Helpful Notes: Also, under project information, statistics check that duration is 20d. Look at the Gantt chart and make sure activity a’s duration days count up to 8.
MSP Enter Budgeted Data for Each Task View, Table, Cost Enter budget amounts as Fixed costs Budget Amounts Entered
MSP Save the Baseline Data 1. So progress at a date can be compared to the planned and budgeted data. Tools, Tracking, Set and Save Baseline, OK. 2. Turn off MSP automatic calculation of actual costs to date. Tools, Options, Calculations. MSP 2010 Project Set Baseline MSP 2010 File Help Options Schedule (scroll down) Calculation options Un-check Actual costs Un-check Un-check
MSP Enter Project Progress Data View, Table, Tracking Enter % Comp amounts and Act. Costs
MSP View automatically calculated project metrics. • Enter current project date. • Project menu, Project Info., enter current date. • View, Table, More Tables, Earned Value, Apply.
MSP Summary of Tasks Enter base information, activities, durations. Set the start date. Set a 7 day work week. Project Guide, Tasks, Define general working times. Enter predecessor(s). Enter task budget amounts as fixed costs. View, Table, Cost Save Baseline Tools, Tracking, Set Baseline. Enter Project Progress Data Turn off auto actual cost calculations Tools, Options, Calculations Enter Actual Costs and Task Percent Complete View, Table, Tracking Enter current project progress date Project menu, Project information Get Metrics View, Table, More Tables, Earned Value MSP 2010 Project Set Baseline MSP 2010 File Help Options Schedule (scroll down) Calculation options Un-check Actual costs Un-check
Project Control: • Project control taking corrective actions to keep the project on target toward meeting its performance goals (time, cost, deliverables). • There are many ways to exert control; the PM must decide which is most appropriate. • Process Reviews • Reports • Personnel Assignment
Scope Creep & Change Control: • Review suggested changes • Assess all impacts to project goals • Evaluate advantages and disadvantages • Consider alternative changes that are better • Allow responsible parties to make decision in light of all information • Communicate changes to everyone involved • Implement changes • Summarize all changes and impacts in report Change Order Approved
Quality Management ProcessesThe Big Picture Quality is the degree to which our deliverables and objectives fulfill the project requirements. Assuring Change requests Corrective actions Training Planning measurements Controlling
Controlling Some Common Project Quality Tools/Data Collection: • Check sheets, frequency counts • Histograms • Pareto chart • Control charts • Cause and effect diagram • Others
Source: http://cokepm.com/pmbok3/premium/8.3PerformQualityControl.htm
Schedule Variance a quantitative measure used by project management personnel to determine schedule performance during or after the completion of a project. It is calculated using a simple algebraic equation where the earned value (EV) represents the actual amount of time taken to either complete the project or progress to the project’s current stage. The planned value (PV) represents the amount of time which reaching the project’s current progress should have taken to achieve according to the project management’s schedule. Schedule variance (SV) is found by subtracting PV from EV. EV-PV=SV Schedule variance and its exact number may indicate many possible things to project management. A number approaching zero would indicate that the scheduling and timeframes generated by project management were accurate within a small margin of error. A figure that is well into negative numbers would mean that either project management over estimated the amount of time needed or they overestimated the budget and workforce measured in raw man hours that would necessary to complete the project. This is not a good thing either as it represents an unnecessary expenditure of resources. A schedule variance figure high in positive numbers could represent many things. It could indicate that project management underestimated the amount of time needed to complete the project, or it might indicate that the budget and workforce was insufficient. It could also mean that project management or the workforce suffered setbacks, foreseen or otherwise, which may or may not have been avoidable. This term is defined in the 3rd edition of the PMBOK but not in the 4th. Source: http://project-management-knowledge.com
Cost Variance The term cost variance, also known by the abbreviation of CV, refers specifically to the true measurement of cost performance on a particular project. The cost variance represents the algebraic difference between the earned value of a project (also known by the abbreviation of EV), and the actual cost of the project (also known by the abbreviation AC). The equation to determine the cost variance would be broken down as follows: CV = EV minus AC. If the resulting value for the cost variance is a number greater than zero (or “positive value”), then it is considered to be a favorable cost variance condition. A value that is less than zero, or a resulting “negative” value, represents a cost variance that is considered less than favorable. Because the cost variance is so dependent on the earned value and the actual cost, in order to maintain a favorable cost variance, it is to the project team’s advantage to minimize actual costs to the extent possible. This term is defined in the 3rd and the 4th edition of the PMBOK. Source: http://project-management-knowledge.com