Download
1 / 13
130 likes | 312 Views
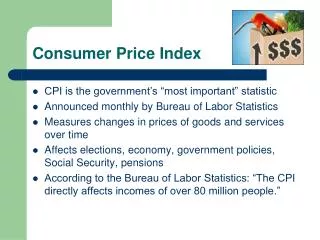
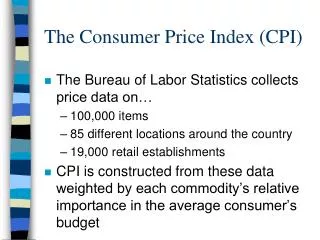
Definition:The Consumer Price Index (CPI) also referred to as a Retail Price Index (RPI) is a current social and economic indicatorCPI is Constructed to measure changes over time in the general level of prices of consumer goods and services. (It is a pointer to the direction of retail prices move

E N D
1. THE NEW CONSUMER PRICE INDEX (CPI) Presented by
Director General
KENYA NATIONAL BUREAU OF STATISTICS (KNBS)
3rd March 2010
1
2. 2
3. 3
4. BROAD CATEGORIES OF GOODS AND SERVICES 4 Groups were reclassified based on the Consumption classification of Individual Consumption by Purpose (COICOP)Groups were reclassified based on the Consumption classification of Individual Consumption by Purpose (COICOP)
5. EXPENDITURE PROPORTIONS (WEIGHTS) Expenditure Proportions as derived from the 2005/06Household Budget Surveys are were as follows
Food & Non-Alcoholic Beverages 36.0%
Alcoholic Beverages, Tobacco & Narcotics 2.1 %
Clothing & Footwear 7.4 %
Housing, Water, Electricity, Gas and other Fuels 18.3%
Furnishings, Household Equipment 6.2 %
Health 3.1 %
Transport 8. 7 %
Communication 3.8 %
Recreation & Culture 2.3%
Education 3.1%
Restaurant & Hotels 4.5 %
Miscellaneous Goods & Services 4.5%
Total 100.0% 5 Weights for the grouping different from those earlier published due to the reclassificationWeights for the grouping different from those earlier published due to the reclassification
6. SELECTION OF ITEMS Three baskets for lower, Middle and Upper Income groups were constructed for Nairobi province.
Seven other baskets were constructed for each province.
In each basket we have different items with different weights.
Significance of each province (shown in brackets) is the proportion of national expenditure.
The number of items are as follows-
Nairobi Lower=181 Nairobi Middle=190 Nairobi Upper=146
Nairobi Combined = 224 (54.58) Central=184 (5.48)
North Eastern=136 (0.89) Coast=187 (11.92)
Rift Valley=197 (12.04) Eastern =203 (3.95)
Nyanza =207 (8.46) Western=190 (2.69)
6 In the 2005/06 Survey, every item which had an expenditure of 0.5 per cent total expenditure was selected in the basket.
In the 2005/06 Survey, every item which had an expenditure of 0.5 per cent total expenditure was selected in the basket.
7. NEW ITEMS IN THE CPI BASKET Over time, consumption patterns have changed and new products introduced into the market. Some of the new products introduced in the baskets include:
Pork Parking charges,
Arrow roots Boda boda fares
Wimbi flour Cell phone airtime
Black grams (njahi) Internet costs
Capsicum (pilipili hoho) Cellular handsets
Camel meat Computers
Fresh un packeted milk
Mineral water
Laboratory tests
Optician services 7
8. Why different regional baskets? Different regions have varying consumption patterns.
A)Some items are significant only in certain areas and not in others e.g.
Camel meat � North Eastern and Eastern
Pork � Nairobi (Middle, Upper), Central and western
Wines � Nairobi (Middle and Upper)
Coconut - Coast 8
9. Cont� B) Some items are in-significant in certain areas e.g.
North Eastern� Chicken, LPG, Operations and Surgery, Maisonette, Sweet potatoes and Primary school transport
Nairobi Upper Income � Loose maize grain , Firewood, and Tailoring services
Nairobi lower Income � Wall unit 9
10. INCOME GROUPS IN THE NEW CPI BASKET The new CPI has 3 income groups in Nairobi i.e. Lower, Middle and Upper (Compared to previous 2).
The percentage of income groups-
Lower 72.12 per cent amount less than Ksh 23,671 per month
Middle 24.12 per cent amount between Ksh 23,672 and 119,999 per month
Upper 3.76 per cent amount more than Ksh 120,000 per month. 10
11. SELECTED TOWNS FOR DATA COLLECTION The number of towns where consumer prices will be collected remain 25 as in the previous basket. However, some towns like Kilifi, Meru, Kakamega and Kitale have been dropped and replaced with Machakos, Bungoma, Kajiado and Thika.
These towns were selected based on expenditures. 11
12. DATA COLLECTION POINTS IN THE PROVINCES Nairobi � Githurai, Eastleigh, Kangemi, Kawangware, Dandora, Kariobangi, Kibera, Central Business District, Westlands and South C.
Coast-Mombasa-(Kisauni, Changamwe, Town Centre) and Malindi
Eastern-Machakos
Central-Nyeri and Thika
North Eastern-Garissa
Rift Valley-Nakuru, Eldoret, Kajiado and Nyahururu.
Nyanza-Kisumu and Kisii
Western-Bungoma
12
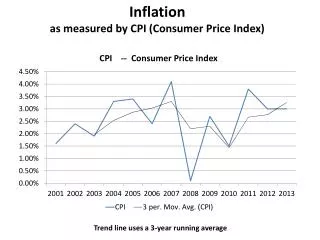
13. INFLATION RATES FOR FEBRUARY 2010 Overall Kenya Index = 5.2
Provinces excluding Nairobi =5.0
Nairobi Combined Index = 5.4
Nairobi Lower Income = 6.2
Nairobi Middle Income = 2.9
Nairobi Upper Income = 5.6 13
14. THE END
Thank you for Listening.
14