Download

1 / 18
180 likes | 262 Views
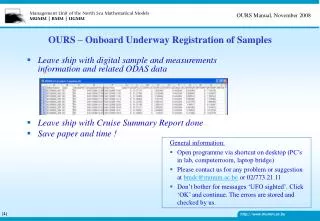
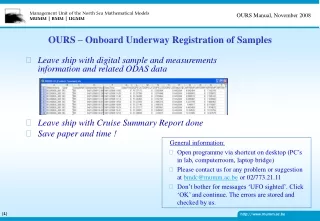
Webinar Preparation Underway. If you cannot hear meeting room activity on your computer: Be sure your computer audio volume is high enough to hear

E N D
Webinar Preparation Underway If you cannot hear meeting room activity on your computer: Be sure your computer audio volume is high enough to hear If there’s still a problem, use the “Chat Box” facility of Webex to request a telephone callback. (The Chat box is reachable from the green tab at the top of your screen.)
Instructions for Participants How to hear the audio (in order of preference): • Use your computer audio to follow the training • This should work with Windows and Mac, but maybe not with Linux • Ask the host (via chat) to allow you to use the telephone for audio Participants not in the meeting room at NAS have been muted • This should reduce cross-talk and provide everyone with better audio Questions are welcome during the presentation: • Ask a question in the Chat facility • The host will be monitoring and will relay your question to the speaker • If the question is too complicated to ask in text, ask the host (via Chat) for a callback
Using Excel to Analyze Experimental Data, Part I Tips and Tricks that Simplify Handling Large Amounts of Data May 8, 2013 NASA Advanced Supercomputing Division
Preface • The webinar assumes basic knowledge of Excel • The advice here is somewhat unconventional and is influenced by: • The author’s computer science background • The author’s experiences with large workbooks for analyzing • Benchmarking data • PBS usage data • There is a lot of material here • You may need to invest some time after the talk to experiment with the techniques described • To help with that there is an accompanying workbook: • Excel_Webinar_Examples.xlsx • Some of the techniques here are Excel-specific • Some will not work with OpenOffice, Numbers (Apple), or Google Tools
Excel as a Model of Computation • A table of cells containing • Input values • Formulas for calculating values • In computer science terms: a functionalprogram • Just expressions (functions) being evaluated • There are no side effects • “Answers” appear in one or more of the cells • Contrast with an imperativeprogram • A sequence of statements changes a program state • Functional advantages: easier to write & reason about • Caveat: not considering Visual Basic macros or “goal seek”
Analyzing Data: The Power of a Large Table • Suppose: lots of data from a “parameter” study • E.g. performance scaling • Tip: organize as one large table of records • Where each record has all parameter settings • Example: performance scaling study of Amazon cloud • Table can be huge, e.g. • 1 line for each of the 790k PBS jobs that ran on Pleiades in 2012
Review: Tables and Formulas • Suppose table has a combination of data and formulas ------------------------------------- experiment values ----------------------------------- ------- derived values ------ • When copy & pasting formulas: Excel will “relocate” parts of them • Relative references, e.g. C43, get changed • E.g. In cell D45, the reference C43 is really reference to row-2, column -1 • Would get relocated to D43 when pasting in E45 • Can protect row and/or column from relocation with a $ • “Absolute” reference examples: $C43C$43 $C$43 • E.g. $C43 copied from D45 becomes $C44 when pasted into F46 • Judicious use of relative and absolute addresses will allow copying down the “derived value” columns • (examples on “Big Table” sheet of Excel_Webinar_Examples.xlsx workbook)
Analyzing Tabular Data: The Pivot Table • Pivot Table: a tool for filtering data and applying reductions across similar records • Define a collection of buckets so that every record falls into one bucket • Select a reduction to be performed across all records in each bucket • To use: (see “Pivot Table” sheet of examples book) • Select all rows & columns (with headings) in table • Select menu item Data:Pivot Table… • Answer questions in wizard • Use a table or range in this workbook (should be selection) • EitherNew Worksheet orExisting Worksheet; then OK • Up pops the Pivot Table builder
Pivot Table (continued) • Drag: • “NCPU” to “Row Labels” • “System” to “Column Labels” • “Total execution Wall clock time” to “Values” • Click on “i” to change reduction to “Average” • Can add data filters bydragging column headerlabels to “Report Filter” • Then can select valuesto include/exclude withthat filter • Here filtering on “Model”(= Nehalem) • Note: must Refresh after source data changes
Issues: Handling Changes with Big Tables • Suppose we have: (try out on “Big Table” sheet) • Inserting a row before row 4 yields: • To fix: recopy formulas from above the insertion to all rows at & below • Deleting row 3 yields #REF!in formulas in column G at & below the deletion • Again, to fix: recopy formulas from above the change to bottom of table • Use combination of ADDRESS, INDIRECTto fix insert & delete • The value of ADDRESS(5, 8, , , “sheet1”) is “Sheet1!$H$5” • The value of INDIRECT(“Sheet1!$H$5”)is valueof H5 on Sheet1 • For the G3canuse:INDIRECT(ADDRESS(ROW()-1, COLUMN(),,,) • Won’tbechangedwith copy/paste or insert/delete
Advice: Separate “Program” from “Data” • To apply the same analysis to data from multiple experiments: • Segregate data from formulas • Data for each experiment resides on a sheet by itself • Can be imported easily from .txt fileor.csvfile • No “magic numbers” on formula sheets • Perhaps on separate sheet (more later) • This approach will allow all the formula sheets for the experiments to be identical • Pull data from data sheet and magic numbers from a parameter sheet • Makes it easy to modify the analysis and apply it to all experiments
Trick #1: “Copying” Data to Formula Sheet • If you want your table to look like: ------------------------------------- experiment values ----------------------------------- ------- derived values ------ • Pull the experiment values from their sheet with: =INDIRECT(ADDRESS(ROW(),COLUMN(),,,”Sheet1”)) • The value of cell C17 on Sheet2 is the one in Sheet1!C17 • So, if Sheet1 starts in A1: • Then Sheet2 could look like: • Note that the yellow cells all have the identical formula
Trick #2: Facilitating Multiple Experiments • Each experiment has own data and formula sheet • But if all formula sheets refer to “Sheet1” they’ll all pull values from there • Change formula that pulls data to: =INDIRECT(ADDRESS(ROW()-1,COLUMN(),,,$A$1)) and put the experiment data sheet name in cell A1 • Can even pull from sheet in another book (if that book is open in Excel) [filename]sheetname([exp.csv]exp.csvwill work with that CSV file) • OK, but the formula sheets aren’t quite identical (i.e. cell A1) • Note that sheets can’t be completely identical • Excel insists that their sheet names be unique • We’ll use that, but must have a formula that gives us our sheet’s name
Trick #3: Getting the Sheet Name in a Cell • Try out this formula: =CELL("filename",A1) • Returns sheet name formatted something like: nasmac3079:Users:rthood:Research:EC2vsPLD-N:[EC2_DB_v2.0.xlsm]Exper1Formulas • Extract sheet name, Exper1Formulas, with: =RIGHT(CELL("filename",A1),LEN(CELL("filename",A1))-FIND("]",CELL("filename",A1))) (see “SheetName” in examples workbook) • Put the above in cell A1 and all formula sheets can be identical (except for their name) • Put a formula in B1 to calculate experiment data sheet name given that experiment formula sheet name is in A1 • Change formula to pull data values to: =INDIRECT(ADDRESS(ROW()-1,COLUMN(),,,$B$1)) • If have sheet names like: ExperimentN (formulas) and ExperimentNData (data) • Then formula for B1would be: =CONCATENATE(A1, “Data”)
Trick #4: Avoiding “Magic Numbers” • Note that “magic numbers” may be parameters of the analysis • If parameters are the same across all experiments • Could isolate to single sheet and use defined names to reference • Search for “Use names in formulas” in Excel help • If parameters vary across experiments, then 2 options: • Have a sheet with the magic numbers and pull it in at the top of the sheet the way data values are pulled in • Will need to adjust Row()-1in data pulling • Name of parameter sheet could be ExperimentNParams • Put parameters in sheet name and parse them out on the first row • E.g. suppose sheet name (ExperimentN,Param1) is in A1 • Experiment name is: =LEFT(A1,FIND(",",A1)-1) • Parameter is: =RIGHT(A1,LEN(A1)-FIND(",",A1)) • For homework, try parsing parameters of ExperimentN,p1,p2,p3into different cells • With this technique, sheets are basically function calls with parameters!
Recap: A Book with Multiple Experiments • For each experiment, one sheet for each of: • Experimental data, organized as a table of records with a header • Parameter sheet for analysis parameters (optional) • Formula sheet that pulls data values and per-experiment parameters • Sheets are named using a pattern • Allows data & parameter sheet names to be calculated on formula sheet • (see sheets with names beginning with “Exp” in examples workbook) • When analysis needs to change: • Delete all but one of the formula sheets • Modify sheet • Copy sheet as needed for each experiment • Rename copied sheets appropriately to pull correct data • Issue: Graphs & Pivot Tables on copied formula sheets (more later)
Next Time • Review material from this session • Additional Q & A time • Other data manipulation “tricks” • Sorting as a functional operation • Reductions across multiple sheets • Array formulas • Introduction to Visual Basic for adding functions
Questions? A PDF and recording of this webinar will be available within 48 hours at: http://www.nas.nasa.gov/hecc/support/training.html Next Webinar “Using Excel to Analyze Experimental Data, Part II” tentatively scheduled for Wednesday May 22, 2013 at 11am Suggestions for future webinar topics are welcome High End Computing Capability