Download
1 / 30
300 likes | 465 Views
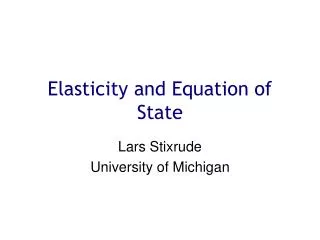
and Equation of State. Agus Haryanto Agricultural Engineering Dept. 16-02-2010. Objectives. Introduce the concept of a pure substance Discuss the physics of phase-change processes Illustrate the P-v, T-v, & P-T diagrams and P-v-T surfaces of pure substances

E N D
and Equation of State Agus Haryanto Agricultural Engineering Dept. 16-02-2010
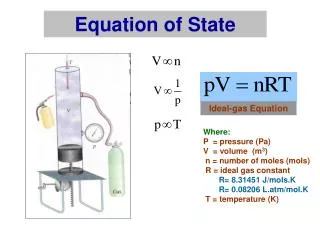
Objectives Introduce the concept of a pure substance Discuss the physics of phase-change processes Illustrate the P-v, T-v, & P-T diagrams and P-v-T surfaces of pure substances Demonstrate the use of property tables Describe “ideal gas” and the ideal-gas EOS Apply the ideal-gas EOS for typical problems Introduce the compressibility factor Present some of the best-known equations of state.
PURE SUBSTANCE Is a substance that has a fixed chemical composition throughout. Eg.: Water, N2, He, and CO2. A mixture of elements can be a pure substance if the mixture is homogeneous. (Eg.: Air) Mixture of oil & water is NOT a pure substance. Mixture of two phases is a pure substance if the chemical composition is the same. Mixture of ice n water is a pure substance. Mixture of liquid air and gaseous air is NOT since the composition is different.
PHASES OF A PURE SUBSTANCE A phase : distinct molecular arrangement that is homogeneous throughout and separated from the others by boundary surfaces. Primary: Solid, Liquid, Gas A substance may have several phases, each with a different molecular structure: * Carbon: 2 solid phases (graphite or diamond). * Helium: 2 liquid phases * Iron: 3 solid phases * Ice: 7 phases at high pressures.
SOLID • The molecules are arranged in a three-dimensional pattern (lattice). • Intermolecular bonds are so strong that molecules are closely packed. • The attractive forces (turn to repulsive forces) of molecules on each other are large and keep the molecules at fixed positions.
LIQUID • The molecular spacing is almost similar to solid, they are not in fixed positions. • Groups of molecules move about each other They can rotate and translate freely. Intermolecular forces are weaker than solids, but stronger than gases. The distances between molecules increase as a solid turns liquid, except for water.
GAS • Interaction between the molecules are collisions • Molecules are at a considerably higher energy level release a large amount of energy before gas condense or freeze. Molecules are far apart. No molecular order. Molecules move about at random, continually colliding with each other and the walls. Intermolecular bonds are weak (Intermolecular forces are small)
PHASE-CHANGE PROCESSES • There are many practical situations where two phases of a pure substance coexist in equilibrium. • Water exists as a mixture of liquid and vapor in the boiler and the condenser of a steam power plant (PLTU). • The refrigerant turns from liquid to vapor in the freezer of a refrigerator. • Our focus: the liquid and vapor phases and their mixture.
PHASE-CHANGE: Imaginary Experiment w/ WATER State 1: compressed liquid • A piston–cylinder containing liquid water at 20°C and 1 atm pressure (state 1). • Water exists in the liquid phase, called compressed liquid, or a subcooled liquid, meaning that it is not about to vaporize. • Heat is added (to 40oC) but, water slightly expands, piston slightly increase, P still 1 atm, phase compressed liquid.
PHASE-CHANGE: Imaginary Experiment w/ WATER State 2: saturated liquid • More heat is added until it reaches 100°C and 1 atm (state 2). • Water starts to boil • Still a liquid, but any heat addition will cause some of the liquid to vaporize. • A liquid that is about to vaporize is called a saturated liquid. • A phase-change process from liquid to vapor is about to take place.
PHASE-CHANGE: Imaginary Experiment w/ WATER State 3: saturated liquid – vapor mixture • More heat is added phase change occurs. • Liquid water turn to vapor. • State 3: saturated liquid – vapor mixture (saturated liquid and vapor coexist I equilibrium). • T = 100°C and 1 atm • Gas volume increases, liquid decrease.
PHASE-CHANGE: Imaginary Experiment w/ WATER State 4: Saturated vapor More heat is added all liquid water turn to vapor. State 4: saturated vapor (vapor that is about to condense) T = 100°C and 1 atm Any heat loss from this vapor will cause some of the vapor to condense (phase change from vapor to liquid).
PHASE-CHANGE: Imaginary Experiment w/ WATER State 5: Superheated vapor More heat is added T increases, v increases State 5: superheated vapor (vapor that is NOT about to condense) T = 300°C and 1 atm The END P-v Diagram
Saturation Temperature (Tsat) and Saturation Pressure (Psat) • “water boils at 100°C” (INCORECT) • “water boils at 100°C at 1 atm” (CORECT) • The temperature at which a pure substance changes phase is called the saturation temperature Tsat. • The pressure at which a pure substance changes phase is called the saturation pressure Psat. • @ 101.325 kPa, Tsat is 99.97°C. • @ 99.97°C, Psat is 101.325 kPa. • @ 100.00°C, Psat is 101.42 kPa. • More: see Saturation tables
Tsat and Psat liquid–vapor saturation curve Psat = f(Tsat)
Elevation, Patm, and Tsat Variation of the standard atmospheric pressure and the boiling (saturation) temperature of water with altitude
LATENT HEAT Large energy is required to melt a solid or vaporize a liquid. The amount of energy absorbed or released during a phase-change process is called the latent heat. Latent heat of fusion is energy absorbed during melting (= energy released during freezing). Latent heat of vaporization is energy absorbed during vaporization (= energy released during condensation). Latent heats depend on T or P of phase change. @ 1 atm, latent heat of fusion of water is 333.7 kJ/kg and latent heat of vaporization is 2256.5 kJ/kg.
P-v Diagram Including Solid phase
P-v Diagram WATER
P-v-T Surface For WATER
Triple Line = Triple Point Under some conditions: all three phases of a pure substance coexist in equilibrium. On P-v or T-v diagrams, these triple-phase states form a line called the triple line. The states on the triple line of a substance have the same P and T but different v. On the P-T diagrams triple line appears as a point, therefore, is called the triple point. No substance can exist in the liquid phase in stable equilibrium at P < Ptp.
Water: 0.01°C, 0.6117 kPa P-T Diagram Including Solid phase
Solid-liquid-gas Two ways a substance can pass from the solid to vapor phase: 1. it melts first into a liquid and then evaporates, or 2. it evaporates directly (called sublimation). The 2nd case occurs at P < Ptp value, since a pure substance cannot exist in the liquid phase at those pressures. For substances that have a Ptp > Patm such as solid CO2(dry ice), kapur barus, sublimation is the only way to change from the solid to vapor phase at atmospheric conditions.