Download
1 / 10
100 likes | 166 Views
Remote sensing;. The world beyond aerial photos. In the beginning: Invention. New applications from large to small proliferate Small: LiDAR for Harvest unit profiles 1990’s Large: National mapping and estimation tools for carbon.

E N D
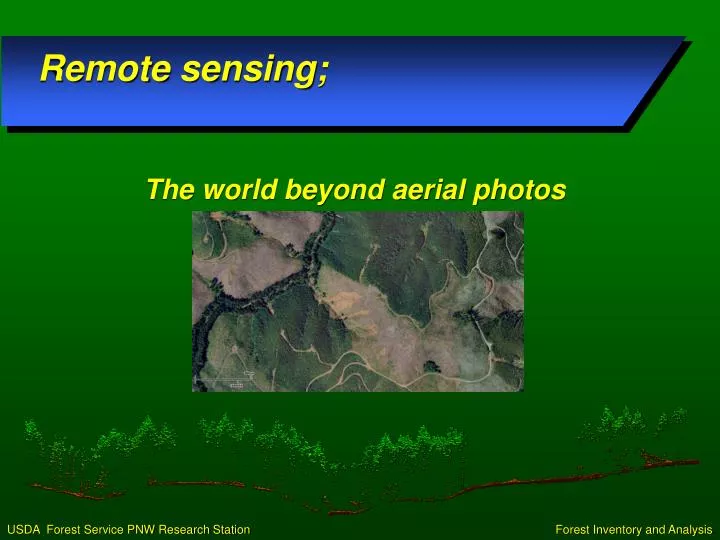
Remote sensing; The world beyond aerial photos
In the beginning:Invention New applications from large to small proliferate Small: LiDAR for Harvest unit profiles 1990’s Large: National mapping and estimation tools for carbon
National AssessmentsMonitoring Change, Carbon Assessments, land use, land cover • North American Forest Dynamics (NAFD) • mapping forest disturbance and cause • Monitoring, Reporting, and Verification (MRV) accounting system • current and historic baseline carbon stocks and trends • Landscape Change Monitoring System (LCMS) • land use and land cover change mapping • National Land Cover Dataset (NLCD) – Tree Canopy Cover • this 30 meter nationwide (CONUS) map depicts tree canopy cover in 2011. • Image-based Change Estimation (ICE) • land use and land cover change information
LiDARindividual tree species classification Brown: Hardwood Green: Conifer Small Scale applications
What is next? • Validation • Consolidation • Applications • Integration
Uncertainty Analyses: Compare biomass estimates and precision from different frameworks and input datasets • Design-based with (1) inventory plots alone (current US NGHGI), (2) plots and LiDAR, and (3) plots, LiDAR, and Landsat • Model-based with (4) plots and Landsat, and (5) plots, LiDAR, and Landsat • (6) Current v. (7) high-precision georeferenced plot locations Validation USFS (Cohen – PI, Andersen, Healey, Moisen, Schroeder, Woodall, Domke), OSU (Yang), SUNY (Stehman), BU (Kennedy, Woodcock, Zhu), USGS (Vogelmann, Steinwand), UMD (Huang)
Consolidation FROM: • Purpose • Purpose • ProcessData Product 1 • ProcessData Product 2 TO: Product 1 • Process • Data Purpose Product 2 Purpose
Acquiring accurate FIA plot locations using survey-grade GPS receiver on Kenai Peninsula (August, 2008) Courtesy: Ray Koleser Application2014 Tanana Pilot: High-accuracy GPS • Accurate plot locations are critical for matching high-res remote sensing & field data • In 2-phase sampling designs, error in plot locations directly influences the precision of parameter estimates • Dual-frequency GPS+GLONASS receivers can acquire coordinates with < 1 m error in all boreal forest conditions