Download
1 / 20
200 likes | 380 Views
A Mixed Queueing Network Model of Mobility in a Campus Wireless Network. Yung- Chih Chen Jim Kurose and Don Towsley Computer Science Department University of Massachusetts Amherst. Motivation. Mobility modeling (till now) Theoretical models Random WayPoint /Walk

E N D
A Mixed QueueingNetwork Model of Mobility in a Campus Wireless Network Yung-Chih Chen Jim Kurose and Don Towsley Computer Science Department University of Massachusetts Amherst
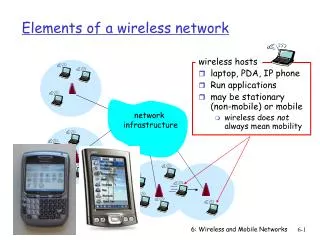
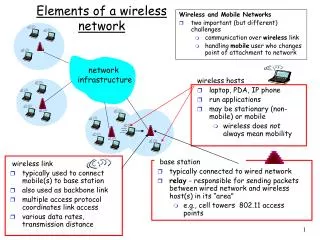
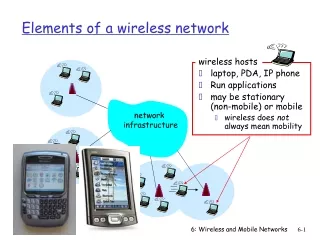
Motivation • Mobility modeling (till now) • Theoretical models • Random WayPoint/Walk • Real world user mobility modeling • Mobility pattern [Kim’07, Hsu’06] • Contact-based mobility [Chaintreau’06, Hsu’10] • Group-based mobility [Hong’99, Wang’02, Chen’10] • Merge/split process [Heimlicher’10] • Modeling becomes complicated….
Goal • Simple model to capture user behavior • Users moving from AP to AP • Predict system level performance • AP occupancy distribution • Predict user level performance • Time stay in network • Number of visited APs • Network dimensioning
User Behavior: Campus Network Midnight Early Morning Evening • Focus on modeling the period when • network more active and heavily used • A closer look of this stable period
User Behavior: Campus Network APM APi Stay Transition APj Arrive Depart • Some “arrive and depart” • Some “always” in the network • Transitions between APs • Stay times at AP
Model APj APi • A mixed network consists of two types of users • Open class (,,) • Arrive, stay, and eventually leave • Poisson arrivals, general stay time • APs are modeled as M/G/∞queues • As if infinite number of servers • AP Occupancy Distribution • Poisson distribution • AP load (open): • Closed class (N,) • Always active inthe network • N : fixed population (average over each day) • : Visit ratio to AP • AP occupancy distribution • Binomial distribution: Poisson distribution • AP load (closed): • Mixed Network • APs are modeled as M/G/∞queues • AP occupancy distribution • Open PDF + closed PDF: Poisson distribution • APi load: stay: APk M/G/∞queues APi APj APk
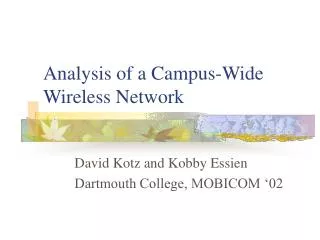
Trace • Mobility • User moving from AP to AP • User/AP association/disassociation messages • Dartmouth Trace* • 17 weeks on Dartmouth College campus • 6000+ users • 550+ Cisco APs • Simple Network Management Protocol (SNMP) • Central controller polls each AP every 5 minutes • AP replies which clients (MAC addresses) are with it • Know when a user joins network, how long he stays • Infer departure by a user’s absence in the subsequent poll *CRAWDAD archive: http://www.crawdad.org/
Trace (Con’t) • Interested in periods most active • Remove weekends/holidays/inter-session breaks • Stable network traffic • 9 AM to 5 PM • 544 APs with 5,715 distinct MAC addresses
Validation: User Occupancy at APs APi load: (parameters obtained from the trace) How about other APs? • Example: The most heavily loaded AP • Kolmogorov-Smirnov goodness of fit (K-S) • :CDF of empirical data • : CDF of model predictions • : K-S statistic (max diff. of 2 dist.) • Accept if small enough ( 95% conf. level)
Validation: Mean Network Stay Time, #Visited APs • : network stay time starting at APi • Can be solved analytically • Mean network stay time: • Model prediction : 141 mins • Empirical average: 133 mins • # visited APs: let =1 • Model prediction : 2.1 APs • Empirical average: 2.07 APs Only 5% difference ! Only 1.4% difference !
Network Dimensioning • What if arrival rate/population increase? • Assume user mobility does not change • : open class user’s average stay time at APi • : closed class user’s fraction of time visiting APi • Assume AP has capacity K • Serve K users simultaneously w/ guaranteed QoS • APi is overloaded if • AP can not meet all users’ QoS • =1% in the following scenarios
Network Dimensioning -Open • Increase of arrivals to each AP (arrival rate ) =1 =2 =3 =4 =5 Must triple capacity if 5to maintain the same QoS
Network Dimensioning - Closed • Increase of closed population (N ) =441 =882 =1323 =1764 =2205 Must double capacity if N 5N to maintain the same QoS
Conclusion • Proposed simple queueing model of mobility • open and closed class users • Validated against empirical traces • Good predictions of metrics of interest • System-level • 93.25 % accuracy on user occupancy distribution • User-level • Mean network stay time: 8 minutes difference • # visited APs: 1.4% difference • The model can be used for network dimensioning • Increase of arrival rate to each AP • Increase of always active population
References • W.-j. Hsu, D. Dutta, and A. Helmy. ”Mining behavioral groups in large wireless lans,” Mobicom’07 • M. Kim and D. Kotz. “Extracting a mobility model from real user traces,” Infocom’06 • A. Chaintreau, P. Hui, J. Crowcroft, C. Diot, R. Gass, and J. Scott. “Impact of human mobility on the design of opportunistic forwarding algorithms,” Infocom’06 • W.-j. Hsu and A. Helmy. “On nodal encounter patterns in wireless lan traces,” IEEE Transactions on Mobile Computing’10 • S. Heimlicher and K. Salamatian. “Globs in the primordial soup: the emergence of connected crowds in mobile wireless networks” MobiHoc’10. • Y.-C. Chen, E. Rosensweig, J. Kurose, and D. Towsley. “Group detection in mobility traces,” IWCMC’10 • X. Hong, M. Gerla, G. Pei, C-C. Chiang. “A Group Mobility Model for Ad Hoc Wireless Networks,” IEEE MSWiM’99 • K. H. Wang, and B. Li. “Group Mobility and Partition Prediction in Wireless Ad-Hoc Networks,” ICC’02
Thanks! ?? || /**/
Trace Pre-Processing (Con’t) • Departure threshold • User did leave the system and returned • User was in motion, moving from AP1 to AP2 • Missing SNMP reports Session: start w/ first AP association; end w/ disassociating w/ all campus APs S2 S1 <threshold ∆ S’=S1+ ∆ +S2
Trace Pre-Processing (Con’t) • Multiple associations • In the same 5-minute window, more than 1 AP report a specific user is associated with it • User is in motion, moving from 1 AP to another AP(s) • Keep the last associated AP, and remove all the rest • Ping-Pong effect • User associates with a fixed set of AP, one after one but only with very short amount of time • Mainly due to weak Wi-Fi signal • Hard to tell when this happens/ how many APs involved • Treat as regular transitions
Verifying Poisson Assumption • Poisson arrivals to each AP • Aggregation of Poisson processes is Poisson • Daily inter-arrival times to campus network • Average (exponential distribution) • : squared correlation from 0~1 (1 as perfect fit) • Explain 96% of variability • Tail outliers • 0.23% • Improve • 0.02 on average • worst fitted day • (
User Occupancy at APs • Open class PDF • Poisson distribution • AP load (open): • Closed class PDF • Binomial distribution: Poisson distribution • AP load (closed): • Mixed network PDF • Open PDF + closed PDF • Poisson distribution • APiload: