Download
1 / 1
10 likes | 80 Views
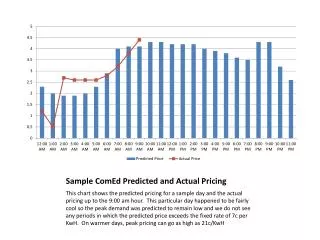
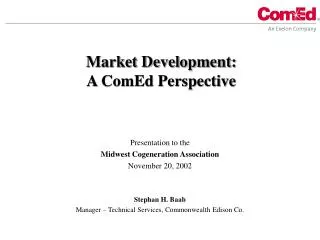
This chart displays the predicted and actual pricing for a sample day up to the 9:00 am hour. Despite the cool weather leading to low peak demand, the pricing does not exceed the fixed rate of 7c per KwH. On warmer days, peak pricing may reach 21c/KwH.

E N D
Sample ComEdPredicted and Actual Pricing This chart shows the predicted pricing for a sample day and the actual pricing up to the 9:00 am hour. This particular day happened to be fairly cool so the peak demand was predicted to remain low and we do not see any periods in which the predicted price exceeds the fixed rate of 7c per KwH. On warmer days, peak pricing can go as high as 21c/KwH


![Actual BH0-012 Exam [PDF] Sample Questions Answers](https://cdn4.slideserve.com/7884731/slide1-dt.jpg)
![Actual ST0-200 Exam [PDF] Sample Questions Answers](https://cdn4.slideserve.com/7884897/symantec-dt.jpg)
![Actual E20-507 Exam [PDF] Sample Questions Answers](https://cdn4.slideserve.com/7884910/slide1-dt.jpg)
![Actual T7 Exam [PDF] Sample Questions Answers](https://cdn4.slideserve.com/7886395/worldatwork-dt.jpg)
![Actual E20-357 Exam [PDF] Sample Questions Answers](https://cdn4.slideserve.com/7886410/slide1-dt.jpg)
![Actual 500-007 Exam [PDF] Sample Questions Answers](https://cdn4.slideserve.com/7886614/cisco-dt.jpg)
![Actual VCS-276 Exam [PDF] Sample Questions Answers](https://cdn4.slideserve.com/7887683/veritas-dt.jpg)
![Actual ICYB Exam [PDF] Sample Questions Answers](https://cdn4.slideserve.com/7887962/iassc-dt.jpg)
![Actual 300-365 Exam [PDF] Sample Questions Answers](https://cdn4.slideserve.com/7888137/cisco-dt.jpg)
![Actual M2090-733 Exam [PDF] Sample Questions Answers](https://cdn4.slideserve.com/7888375/slide1-dt.jpg)
![Actual S90-03A Exam [PDF] Sample Questions Answers](https://cdn4.slideserve.com/7888546/arcitura-education-dt.jpg)
![Actual MB2-714 Exam [PDF] Sample Questions Answers](https://cdn4.slideserve.com/7888601/microsoft-dt.jpg)
![Actual ATM Exam [PDF] Sample Questions Answers](https://cdn4.slideserve.com/7889176/istqb-dt.jpg)
![Actual MAC-16A Exam [PDF] Sample Questions Answers](https://cdn4.slideserve.com/7889340/apple-dt.jpg)
![Actual HPE0-J79 Exam [PDF] Sample Questions Answers](https://cdn4.slideserve.com/7889899/slide1-dt.jpg)