Performance Engineering and Debugging HPC Applications
Performance Engineering and Debugging HPC Applications. David Skinner deskinner@lbl.gov. Today: Tools for Performance and Debugging. Principles Topics in performance scalability Examples of areas where tools can help Practice Where to find tools Specifics to NERSC and Hopper.

Performance Engineering and Debugging HPC Applications
E N D
Presentation Transcript
Performance Engineering and Debugging HPC Applications David Skinner deskinner@lbl.gov
Today: Tools for Performance and Debugging • Principles • Topics in performance scalability • Examples of areas where tools can help • Practice • Where to find tools • Specifics to NERSC and Hopper
Big Picture of Scalability and Performance
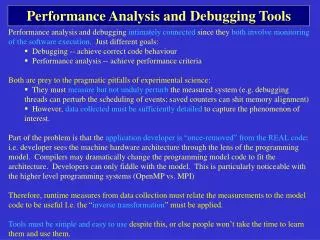
Performance is Relative • To your goals • Time to solution, Tqueue+Trun • Your research agenda • Efficient use of allocation • To the • application code • input deck • machine type/state • Suggestion: • Focus on specific use cases • as opposed to making • everything • perform well. • Bottlenecks can shift.
Performance is Hierarchical instructions & operands lines pages messages blocks, files
Tools are Hierarchical PAPI Craypat • IPM Tau valgrind PMPI SAR
Using the right tool Tools can add overhead to code execution What level can you tolerate? Tools can add overhead to scientists What level can you tolerate? Scenarios: Debugging code that ~isn’t working Performance debugging Performance monitoring in production
One tool example: IPM on XE 1) Do “module load ipm”, link with $IPM, then run normally 2) Upon completion you get Maybe that’s enough. If so you’re done. Have a nice day ##IPM2v0.xx######################################################## # # command : ./fish -n 10000 # start : Tue Feb 08 11:05:21 2011 host : nid06027 # stop : Tue Feb 08 11:08:19 2011 wallclock : 177.71 # mpi_tasks : 25 on 2 nodes %comm : 1.62 # mem [GB] : 0.24 gflop/sec : 5.06 …
HPC Tool Topics • CPU and memory usage • FLOP rate • Memory high water mark • OpenMP • OMP overhead • OMP scalability (finding right # threads) • MPI • % wall time in communication • Detecting load imbalance • Analyzing message sizes
Scaling: definitions • Scaling studies involve changing the degree of parallelism. Will we be change the problem also? • Strong scaling • Fixed problem size • Weak scaling • Problem size grows with additional resources • Speed up = Ts/Tp(n) • Efficiency = Ts/(n*Tp(n)) Be aware there are multiple definitions for these terms
Conducting a scaling study Example: How large a 3D (n^3) FFT can I efficiently run on 1024 cpus? Looks good? With a particular goal in mind, we systematically vary concurrency and/or problem size
The scalability landscape • Algorithm complexity or switching • Communication protocol switching • Inter-job contention • ~bugs in vendor software • Why so bumpy? Whoa!
Not always so tricky Main loop in jacobi_omp.f90; ngrid=6144 and maxiter=20
Load (Im)balance Communication Time: 64 tasks show 200s, 960 tasks show 230s MPI ranks sorted by total communication time
Load Balance : cartoon Unbalanced: Universal App Balanced: Time saved by load balance
Not so simple: Comm. topology MAESTRO GTC MILC PARATEC IMPACT-T CAM 20
The state of HW counters • The transition to many-core has brought complexity to the once orderly space of hardware performance counters. NERSC, UCB, and UTK are all working on improving things • IPM on XE, currently just the banner is in place. We think PAPI is working (recently worked with Cray on bug fixes)