Download
1 / 24
240 likes | 385 Views
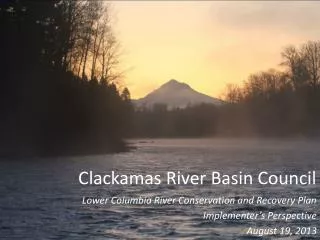
Snapshot Event Monitoring Results for the Clackamas River Watershed. Presented by PSU SWRP Summer Capstone August 12 2010. Background. The Clackamas Watershed What influences Water Quality? PSU and the Student Watershed Research Project. Study Area: The Clackamas River Basin.

E N D
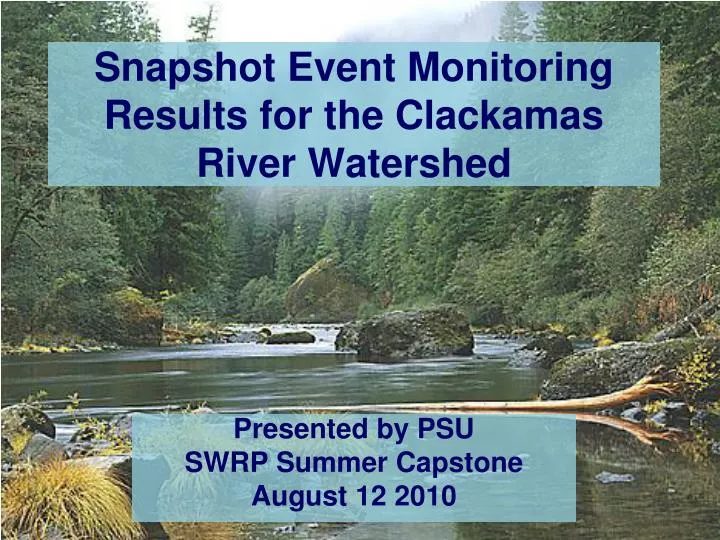
Snapshot Event Monitoring Results for the Clackamas River Watershed Presented by PSU SWRP Summer Capstone August 12 2010
Background • The Clackamas Watershed • What influences Water Quality? • PSU and the Student Watershed Research Project
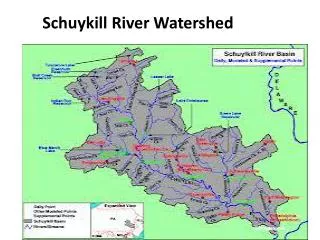
Study Area: The Clackamas River Basin
Parameters Tested • Temperature • Dissolved Oxygen • Turbidity • pH • Nitrogen (Ammonia and Nitrate) • Phosphorous • Macroinvertebrates
Water Temperature & Quality Standards • Clean Water Act and Endangered Species Act
Methodology • Samples were collected on-site and tested for Temperature, DO, Turbidity, and pH in the field • Water samples were tested for Soluble Reactive Phosphorous, Ammonia Nitrogen, and Nitrate Nitrogen in the lab • Each parameter was tested using three replicates, but in the event of extreme outliers two more replicates were tested • Macroinvertebrate analysis included the EPT, Pollution Sensitive/Tolerant and OWEB Level 2 metrics.
Results by Sub-basin:Eagle Creek • With few exceptions the sites at Eagle Creek have favorable water quality conditions • ECK001 had slightly green water and smelled of Chlorine • EGL001 & EGL002 had ammonia readings above the upper limit • Turbidity at EGL002 was above the upper limit • Macroinvertebrate data indicated that the Eagle Creek sub-basin is not impaired and supports adequate macroinvertebrate populations
Results by Sub-basin:Rock Creek • RCK002 had a turbidity measurement significantly above the upper threshold • Ammonia levels exceeded the upper threshold for RCK001 & RCK002 and were at the top of the safe range for RCK000 & SEB002 • RCK001 had a DO measurement close to the minimum threshold for safety and has shown lower DO over time
Results by Sub-basin:Rock Creek • Macroinvertebrate analysis of the Rock Creek sub-basin indicates moderate impairment due to the absence of Trichoptera (Caddisfly), a pollution-sensitive organism
Results by Sub-basin:Deep Creek • NFD001, NFD003, NFD004 show higher nitrate levels from last year • All sites had DO levels above the minimum recommended level • The past few years NFD002, NFD003, & NFD004 exceeded safe phosphorus levels, but this is no longer true as of 2010 • In the past Deep creek has been above the upper threshold of safety for ammonia • This year all sites show lower levels of ammonia, but only NFD001 & NFD003 were at acceptable levels
Results by Sub-basin:Deep Creek • Macro data from Boring Trail Station showed signs of severe impairment and was limited in sensitive and tolerant species
Results by Sub-basin:Lower Goose and Clear Creek • For GCK001 water temp, turbidity, and ammonia levels were slightly high • CLE019 was within standards except for slightly high ammonia levels • Water temp for CLE000 exceeded the standard for a healthy stream • DO for CLE00 and CLA024 was within limits for the time data was collected, but not optimal for spawning conditions
Results by Sub-basin:Lower Goose and Clear Creek • Macroinvertebrate analysis of the Clear Creek sub-basin shows stream quality to be moderately impacted due to the absence of Trichoptera (Caddisfly)
Results by Sub-basin:Richardson Creek • The upstream sites RCH003 & RCH004 had ammonia levels above the limit of 0.03mg/L • A few samples had phosphorus levels above the DEQ mandate of 0.10mg/L. RCH001 was at 0.14mg/L in 2008 and 0.11 mg/L in 2010 indicating some improvement is still needed • Data for RCH001 in 2009 and RCH003 in 2010 indicate higher levels of turbidity
Recommendations to Maintain or Improve Water Quality • Increase the frequency of monitoring • Keep septic tanks well maintained • Remove invasive plants • Keep yard debris, garbage, & chemicals away from streams • Reduce fertilizer and pesticide use
Special Thanks to: Land Owners Water Environment Services Clackamas County Clackamas River Water District