Download
1 / 56
560 likes | 634 Views
Understand energy technologies, impacts on the environment, and sustainability. Learn about carbon dioxide emissions and the global carbon cycle. Explore greenhouse gases, global warming, and the consequences of climate change.

E N D
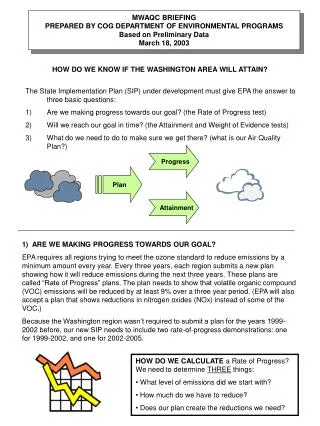
If we do not design ways to live within the means of one planet, sustainability will remain elusive. Source: http://www.footprintnetwork.org/
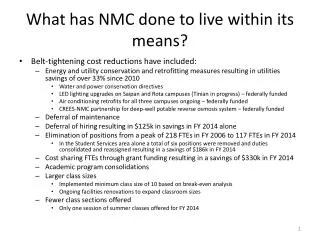
Energyand the Environment Part II CES August 2010 Prof. R. Shanthini Dept of Chemical & Process Engineering Faculty of Engineering University of Peradeniya
Learning Objectives √ • Describe the major energy technologies • Assess the impact of the use of energy from the environmental (ecological) point of view • Demonstrate a comprehensive understanding of - energy sufficiency (conservation) - energy efficiency - energy security and - sustainability issues
Carbon dioxide emissions Global CO2 emissions from the burning of fossil fuels & the manufacture of cement (in 109 kg CO2) Source: http://cdiac.ornl.gov/trends/emis/glo.html
Global Carbon Cycle Fossil-fuel burning 5.3 Numbers are billions of tons of carbon Land use 0.6 – 2.6 Photosynthesis 100-120 Plant respiration 40 - 50 Decay of residues 50 - 60 Sea-surface gas exchange 100 - 115 Net ocean uptake 1.6 – 2.4 Geological reservoir
Atmospheric Carbon dioxide Concentrations CO2 concentration in the atmosphere (in ppmv) 385.3 ppmv in 2008 275 ppmv in pre-industrial time Source: http://cdiac.ornl.gov/
Greenhouse Gases (GHGs) including Carbon dioxide GHGs are gases in an atmosphere that absorb and emit radiation within the thermal infrared range. This process is the fundamental cause of the greenhouse effect.
The Greenhouse effect A T M O S P H E R E S U N G R E E N H O U S E G A S E S
The main GHGs in the Earth's atmosphere are water vapor, carbon dioxide, methane, nitrous oxide, and ozone. Without GHGs, Earth's surface would be on average about 33°C colder than at present.
Global Warming The burning of fossil fuels, land use change and other industrial activities since the Industrial revolution have increased the GHGs in the atmosphere to such a level that the earth’s surface is heating up to temperatures that are very destructive to life on earth.
Global Warming Source: http://cdiac.ornl.gov/trends/temp/hansen/hansen.html
Global Warming The global temperature has risen by 0.74 ± 0.18°C over the last century (from 1906 to 2005). Source: Fourth Assessment Report (AR4) of Intergovernmental Panel on Climate Change (IPCC) Compare the above with the fact that the global temperature has not varied by more than 1 or 2oC during the past 100 centuries. Global warming has begun…..
Consequences………… Climate change
Climate change World’s first environmental refugees from Carteret Islands, Papua New Guinea. • Persistent flooding is causing the submergence of the Carteret Islands. • Saltwater intrusion is contaminating the islands freshwater supply and preventing the growth of crops. • The islands were declared uninhabitable by the government in 2005 and expected to be completely submerged by 2015. Source: http://earthtrends.wri.org/
Climate change • death of coral reefs • fewer cubs for polar bears • spread of dengue and other diseases • heavy rains & severe draughts • fires, floods, storms, & hurricanes • changed rainfall patterns • warming and aridity • loss of biodiversity • and more……………..
At the rate of 1.5 ppmv of CO2 increase per year, 400 ppmv CO2 will be reached in 2018, and it is probable that the global temperature would go up by 2oC (compare it with the 0.01oC per decade estimate by WWF). -Accelerated Climate Change -Mass extinctions -Ecosystems breakdowns -Large scale discontinuities
Some say, forget about the 2oC. The limit is not 400 ppmv CO2. It is550 ppmv CO2(which is nearly twice the pre-industrial value).
Calculation of Global Sustainable Limiting Rate of Carbon Dioxide Production: 1. Virgin material supply limit: To stabilize the atmospheric CO2 concentration below approximately 550 ppmv by the year 2100, global anthropogenic emissions must be limited to about 7 to 8 x 10¹² kg (= 7 to 8 giga tonnes) of C per year (IPCC, 1996). Source: Graedel, T.E. and Klee, R.J., 2002. Getting serious about sustainability, Env. Sci. & Tech. 36(4): 523-9
Calculation of Global Sustainable Limiting Rate of Carbon Dioxide Production: • 2. Allocation of virgin material: • Each of the average 7.5 billion people on the planet over the next 50 years is allocated an equal share of carbon emissions. • This translates to roughly 1000 kg • (1 tonne) of C equivalents • per person per year. Source: Graedel, T.E. and Klee, R.J., 2002. Getting serious about sustainability, Env. Sci. & Tech. 36(4): 523-9
Calculation of Global Sustainable Limiting Rate of Carbon Dioxide Production: 3. Regional “re-captureable” resource base: Recycling of carbon in the form of permanent or semi-permanent sequestration may eventually possible through controversial techniques, not at the moment. Source: Graedel, T.E. and Klee, R.J., 2002. Getting serious about sustainability, Env. Sci. & Tech. 36(4): 523-9
Calculation of Global Sustainable Limiting Rate of Carbon Dioxide Production: 4. Current consumption rate vs. sustainable limiting rate: The U.S. on average produced 5500 kg (5.5 tonnes) of C equivalents per person (including emissions from land use change) in 2000, which is well beyond the global sustainable rate of 1000 kg (1 tonne) of C equivalents per person per year. Source: Graedel, T.E. and Klee, R.J., 2002. Getting serious about sustainability, Env. Sci. & Tech. 36(4): 523-9
HDI > 0.8 USA Sri Lanka Sources: http://hdrstats.undp.org/buildtables/rc_report.cfm
LI EI GDPI + + HDI = 3 3 3 Life Expectancy - 25 LI (Life Index) = 85 - 25 2 Adult Literacy 2 School Enrollment EI (Education Index) = + 3 100 3 100 ln(GDP per capita) - ln(100) GDPI (GDP Index) = ln(40000) - ln(100) UNDP defined Human Development Index (HDI)
HDI > 0.8 Unsustainable amount of per capita CO2 emissions are required to reach super high HDI (> 0.9) USA Sustainable limit Sri Lanka Sources: http://hdrstats.undp.org/buildtables/rc_report.cfm
Discussion Point 3: How to limit the CO2 emissions below the sustainable limit? Take 10 mins.
Peak Oil: Oil supply peak has been reached in many oil fields, Source: BP Statistical Review of World Energy June 2008
Peak Oil: Oil supply peak has been reached in many oil fields, Production from Mexico's largest oilfield, Cantarell, fell from 1.99 million b/d in Jan 2006 to 1.44 million b/d in Dec 2006. Source: http://www.hubbertpeak.com/mx/
Well #34 has run dry and is now pumping fossils Source: www.cartoonstock.com/directory/f/fossil_fuel.asp
“Development that meets the needs of the present without compromising the ability of future generations to meet their own needs.“ - “Our Common Future”, 1987 Dr. Gro Harlem BrundtlandFormer Prime Minister, Norway Former Chair/ World Commission on Environment and Development Responsible for the broad political concept of Sustainable Development
Discussion Point 4: Could we achieve a world that consumes sustainable energy without re-organizing the entire energy system of the present? Sustainable Energy: is energy which is replenishable within a human lifetime and causes no long-term damages to the environment. Renewable Energy: are flows of energy that are regenerative or virtually inexhaustible Take 10 mins.
Option 1:Increase the use of carbon sinks (such as forests where 70% of all photosynthesis occurs). But, we replace our forests with cities, highways & golf courses. Stop destroying forests, and grow more trees. R. Shanthini 19 Jan 2010
The forest cover is already too small to help reducing global warming. How long does it take to grow a tree like this?
Option 2:Change to non-CO2 emitting energy sources What are they? Nuclear Hydro Renewables (Geothermal, Solar, Wave, Tidal, Wind, Biomass and Biogas) Muscle Power
World Energy Consumption by Fuel (in %) http://www.eia.doe.gov/pub/international/iealf/table18.xls
Hydroelectric power • What are the problems with hydroelectric power? • barriers in the natural flow of a river prevents fish from migration, alters ecosystems, and threatens the livelihoods of local communities • the world's 52,000 largest dams release 104 million metric tons of methane (a greenhouse gas) annually • hydropower is not renewable, because reservoirs fill up with sediment and cost billions to dredge • failure of a dam will have catastrophic consequences • loss of land as well as flooding of areas such as natural habitats and existing settlements • The future generations must pay for destroying dams • Is it a sustainable form of energy?
Hydroelectric power The Elwha Dam, a 33 m high dam on the Olympic Peninsula in Washington state, is one of two huge dams built in the early 1900s and set to be removed in 2012. Removal of dam will restore the fish habitats, will create an additional 715 acres of terrestrial vegetation, and improve elk habitats. estimated cost $308 million ± 15%
Solar Energy – Photovoltaic Cells Inorganic Solar Cells 2nd Generation Thin-film Bulk 3rd Generation Materials Silicon Germanium Silicon CIS Amorphous Silicon CIGS Mono-crystalline CdTe Poly-crystalline Nonocrystalline Silicon GaAs Ribbon Light absorbing dyes
Solar Energy – Photovoltaic Cells Inorganic Solar Cells 2nd Generation Thin-film Bulk Processing silica (SiO2) to produce silicon is a very high energy process, and it takes over two years for a conventional solar cell to generate as much energy as was used to make the silicon it contains. Silicon is produced by reacting carbon (charcoal) and silica at a temperature around 1700 deg C. And, 1.5 tonnes of CO2 is emitted for each tonne of silicon (about 98% pure) produced. 3rd Generation Materials Silicon Germanium Silicon CIS Amorphous Silicon CIGS Mono-crystalline CdTe Poly-crystalline Nonocrystalline Silicon GaAs Ribbon Light absorbing dyes
Ecological Footprint (EF) • EF measures (in global hectares) how much land and water area a human population requires to produce the resource it consumes and to absorb its wastes, using prevailing technology. • EF does not include an economic indicator. A global hectare (gha) is a common unit that encompasses the average productivity of all the biologically productive land and sea area in the world in a given year. Biologically productive areas include cropland, forest and fishing grounds, and do not include deserts, glaciers and the open ocean. Source: http://www.footprintnetwork.org/en/index.php/GFN/page/ frequently_asked_questions/#method1
Biocapacity • Biocapacity is shorthand for biological capacity, which is the ability of an ecosystem to produce useful biological materials and to absorb wastes generated by humans. Sustainable global EF per capita = Total Biocapacity per capita = 13.4/6.8 ≈ 2 gha ( ≈ 5 acres) Source: http://www.footprintnetwork.org
For Sri Lanka Source: http://www.footprintnetwork.org
For USA Source: http://www.footprintnetwork.org
EF is 1.3 in 2005. That is to say we need 1.3 planets to provide the resources we use and absorb our waste. This means, in 2005, it took the Earth one year and four months to regenerate what we use in a year. Source: http://www.footprintnetwork.org
EF will be 2 by the mid 2030 if current population and consumption trends continue according to moderate UN scenarios. It means by the mid 2030s we will need the equivalent of 2 Earths to support us. Source: http://www.footprintnetwork.org