Download
1 / 11
110 likes | 220 Views
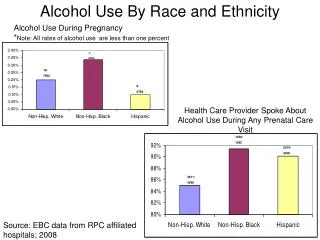
Alcohol Use By Race and Ethnicity. Alcohol Use During Pregnancy * Note: All rates of alcohol use are less than one percent. 7/ 2060. 16/ 7963. 5/ 4794. Health Care Provider Spoke About Alcohol Use During Any Prenatal Care Visit. 1456/ 1592. 3074/ 3409. 3911/

E N D
Alcohol Use By Race and Ethnicity Alcohol Use During Pregnancy *Note: All rates of alcohol use are less than one percent 7/ 2060 16/ 7963 5/ 4794 Health Care Provider Spoke About Alcohol Use During Any Prenatal Care Visit 1456/ 1592 3074/ 3409 3911/ 4595 Source: EBC data from RPC affiliated hospitals; 2008
Illegal Drug Use By Race and Ethnicity Illegal Drug Use During Pregnancy 66/ 2060 34/ 7963 21/ 4794 Health Care Provider Spoke About Illegal Drug Use During Any Prenatal Care Visit 1439/ 1589 3048/ 3403 3822/ 4590 Source: EBC data from RPC affiliated hospitals; 2008
Tobacco Use By Race and Ethnicity Tobacco Use During Pregnancy 743/ 7963 181/ 2060 168/ 4794 Health Care Provider Spoke About Tobacco Use During Any Prenatal Care Visit 1451/ 1593 3080/ 3415 3887/ 4598 Source: EBC data from RPC affiliated hospitals; 2008
Tobacco Use During Pregnancies Delivered at RPC or Affiliated Hospitals By Race, Ethnicity and Maternal County of Residence 285/ 1807 45/ 300 75/ 514 4/ 29 61/ 483 1/ 9 8/ 77 41/ 398 34/ 378 19/ 214 262/ 3185 6/ 79 83/ 1106 53/ 1154 5/ 135 115/ 2851 53/ 2812 21/ 1591 1/ 123 0/ 13 0/ 17 Source: EBC data from RPC affiliated hospitals; 2008
Total Cesarean Births 2008 *Total Cesarean Births= Primary + Repeat Cesarean Births Source: EBC data 2008 Red Line = national average for cesarean births (31.8%) Hamilton BE, Martin JA, Ventura SJ. Births: Preliminary data for 2007. National vital statistics reports, Web release; vol 57 no 12. Hyattsville, MD: National Center for Health Statistics. Released March 18, 2009.
Primary Cesarean Births 2008 Source: EBC data 2008 Red Line = national average for primary cesarean births (23.5%) Martin JA, Hamilton BE, Sutton PD, Ventura SJ, et al. Births: Final data for 2006. National vital statistics reports; vol 57 no 7. Hyattsville, MD: National Center for Health Statistics. 2009.
Primary and Repeat Cesarean Births Source: EBC data 2008 Full Bar = Total Cesarean Births
Delivery Mode By Race and Ethnicity Non-Hispanic Black Non-Hispanic White 1.4% (29) 2.1% (160) 34.4% (2645) 43.2% (876) 55.4% (1123) 63.5% (4878) Hispanic 2.0% (96) 35.4% (1673) *N.S.V.D= Normal Spontaneous Vaginal Delivery 63.1% (2985) *Forceps delivery less than one percent for all races/ethnicities Source: EBC data from RPC Affiliated Hospitals; 2008
Feeding Method at Discharge By Race and Ethnicity Non-Hispanic White Non-Hispanic Black 17.0% (1162) 39.6% (765) 33.2 (642) 18.8% (1290) 64.2% (4398) 27.2% (525) Hispanic 38.9% (1817) 49.8% (2324) 11.3% (527) Source: EBC data from RPC Affiliated Hospitals; 2008
Primary and Repeat Cesarean Births By Race and Ethnicity 569/ 2060 1606/ 7963 759/ 4794 914/ 4794 307/ 2060 1039/ 7963 Source: EBC data from RPC Affiliated Hospitals; 2008 Red Line = national average for primary cesarean births (23.5%) Martin JA, Hamilton BE, Sutton PD, Ventura SJ, et al. Births: Final data for 2006. National vital statistics reports; vol 57 no 7. Hyattsville, MD: National Center for Health Statistics. 2009.
Breastfeeding by Maternal County of Residence, Race and Ethnicity Source: EBC data from RPC Affiliated Hospitals; 2008