Download
1 / 1
10 likes | 121 Views
Explore data analysis applications for Quality Assurance and Spectrometry using SPC and MVR techniques. Visualize and validate data with powerful GUI capabilities and specific applications in the aluminum industry.

E N D
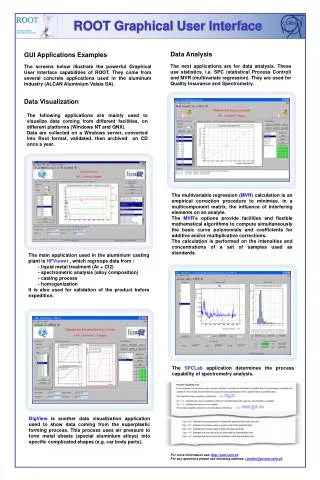
Data Analysis GUI Applications Examples The next applications are for data analysis. These use statistics, i.e. SPC (statistical Process Control) and MVR (multivariate regression). They are used for Quality Insurance and Spectrometry. The screens below illustrate the powerful Graphical User Interface capabilities of ROOT. They come from several concrete applications used in the aluminum industry (ALCAN Aluminium Valais SA). Data Visualization The following applications are mainly used to visualize data coming from different facilities, on different platforms (Windows NT and QNX). Data are collected on a Windows server, converted into Root format, validated, then archived on CD once a year. The multivariable regression (MVR) calculation is an empirical correction procedure to minimise, in a multicomponent matrix, the influence of interfering elements on an analyte. The MVR's options provide facilities and flexible mathematical algorithms to compute simultaneously the basic curve polynomials and coefficients for additive and/or multiplicative corrections. The calculation is performed on the intensities and concentrations of a set of samples used as standards. The main application used in the aluminium casting plant is HFViewer , which regroups data from : - liquid metal treatment (Ar + Cl2) - spectrometric analysis (alloy composition) - casting process - homogenization It is also used for validation of the product before expedition. The SPCLab application determines the process capability of spectrometry analysis. DlgView is another data visualization application used to show data coming from the superplastic forming process. This process uses air pressure to form metal sheets (special aluminium alloys) into specific complicated shapes (e.g. car body parts). For more information see: http://root.cern.ch For any questions please use following address: rootdev@pcroot.cern.ch