Download
1 / 46
460 likes | 480 Views
Explore tumor growth dynamics and sleep patterns, analyzing the influence of size, energy, and vasculature. Connects cellular, structural, and angiogenesis research. Sleep studies investigate molecular mechanisms and inter-species sleep behavior.

E N D
Scaling tumor growth and sleep times by Van Savage Harvard Medical School, Systems Biology Dept. Santa Fe CSSS, 2007
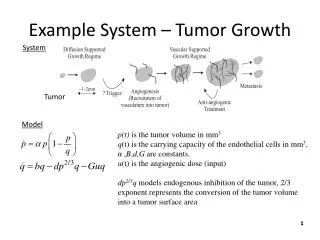
Outline Tumor Growth--Basic Energy Equation Depends on Tumor and Host sizes Two Growth Regimes A. Diffusion of O2 from nearby capillaries B. Tumor develops own vasculature (angiogenesis) 4. Predictions for necrotic core, final sizes, total resistance, etc.
Tumor growth rate changes as tumors grow Haney et al., Soc. forNeuro-Oncol., 2000
Tumor Growth Trajectories: Efficacy of Drugs www.cellectar.com
Ontogenetic Growth West et al., Nature., 2001
Tumor growth is universal? Using same functional form and free parameters as for ontogenetic growth curves Guiot et al., 2003, J. Theor. Biol., 225(2): 147-151
Tumor Growth: Energetics Total metabolic rate for maintenance and growth Rate of production of new cells for growth and replacement Number of viable cells Energy to create a new cell Cellular metabolic rate for maintenance Probability of cell death is independent of tumor size Rate of cell death
Original growth equation becomes Using Nc=mv/mc and defining Bc=Bc,m-Ec How does BT depend on mv?
Phase 1: Pre-Angiogenesis Oxygen and nutrients come by diffusion from nearby capillaries
Phase 1: Pre-Angiogenesis At start all tumor mass viable, mT=mV Exponential growth. But, resources deplete and can’t continue to get all nutrients that normal tissue would have received.
Phase 2: Angiogenesis Oxygen and nutrients from capillaries in tumor’s vasculature To zeroth-order tumor is like its own small organism , but vascular structure may be different and must interface with host vasculature
Two phases: Pre-angiogeniic and early angiogenesis: tumor feeds on diffusion from host vessels. ii. Angiogenesis: tumor has own vasculature
Are network exponents for tumor vasculature similar to normal tissue Space Filling Energy Minimiz. Cubic flow rate for small vessels Roughly yes for mean trend but not variability Data from Jain; Plot from Herman et al., submitted
Early growth, early angiogenesis, no necrosis (mT=mv), small vessels (p=1). Exponential Growth ii. Later angiogenesis, necrosis (mT=mv+mN), large vessels (p=1/(2a+b)). Logistic growth, can solve for mv(t), mN(t), and asymptotic mass
Dependence on total mass, mT Necrotic core Healthy tissue from which vasculature is recruited Tumor volume Tumor • recruitment volume=tumor surface area x (thickness of region) • = ST • depends inversely on endothelial cell density, e We assume ST scales isometrically
Predict necrotic core Dissipation regime: mvmT2/3mv/mTmT-1/3 Pulsatile regime: mv1/(2a+b)mT2/3 mv/mTmT2(2a+b)/3-1 Transition occurs (2/3->~8/9).
Prediction of mv~mT2/3->8/9 Data from Baker et al., (1990) Growth, Development, and Ageing, 54: 85.; Plot from Herman et al., submitted
Growth trajectories with two phases Data from Steel, Growth Kinetics of Tumors (Clarnedon Press, 1977). Plot from Herman et al., submitted
Dependence on Host Size Pre- and early angiogenesis: Metabolic rate of tumor has pre-factor that depends on Also, this pre-factor is part of the time constant This may set natural time scales across species for growth, occurrence rates, drug dosing, etc.
Why is this useful? 1. Connects cellular, structural, angiogenesis, and growth research in mechanistic way. These are usually studied in isolation. Unifying them is necessary for understanding. 2. Connected to last point, it might help determine best times for interventions and which interventions are best at which stages. 3. Helps to interpret what cancer studies in other organism mean for humans. 4. Cancer may be great probe for how network structure and assumptions of original scaling theory can be violated and what that means.
Sleep! O gentle sleep! Nature’s soft nurse, how have I frighted thee, That thou no more wilt weigh my eyelids down And steep my senses in forgetfulness? --Shakespeare [sleep] 'tis meat for the hungry, drink for the thirsty, heat for the cold, and cold for the hot. 'Tis the current coin that purchases all the pleasures of the world cheap; and the balance that sets the king and the shepherd, the fool and the wise-man even. There is only one thing that I dislike in sleep; 'tis that it resembles death; --Cervantes Sleep Times: Why Do We Sleep?
Focus on molecular mechanisms that distinguish sleep from waking and that drive sleep Study single species’ sleep behavior and coordination with physiological and cellular properties 3. Inter-specific studies that in some sense average across species and allow one to compare and contrast across species and look for trends ALL of these are incredibly useful and should be done in parallel and will inform the other directions. Studies of Sleep Function
Rich History of Inter-Specific Sleep Studies Based on linear-log and log-log transforms Zepelin and Rechtschaffen, Brain. Behav. Evol. (1974)
carnivores herbivores Siegel Studies omnivores all Siegel, Nature (2005)
Sleep Times Across Species -Larger animals generally sleep less than smaller animals. Mice sleep ~14 hours per day Humans sleep ~8 hours per day Elephants sleep ~3 hours per day Whales sleep ~1.5 hours per brain hemisphere per day -Sleep times show negative correlation with body mass, metabolic rate, and brain mass. Positive correlation with mass-specific metabolic rate. -Trend may depend on diet and behavior
Questions About Previous Studies Why plot data in this way? What are the correct transforms (linear-log, log-log, linear-linear, etc.) and combinations of variables/data to plot against each other? What can we learn from plot besides just strength of correlation and (at most) direction of trend? Why ignore information about slope and curvature? What does this mean in the context of specific theories/hypotheses for the function of sleep? What does this mean in the general context of inter-species comparisons and allometric scaling? We will answer these questions in reverse order. Answering 3 and 4 gives answers about 1 and 2.
Total Sleep Time General 1/4-Power Scaling for Biol. Times Number of Times with Exponent Scaling Exponent Times at the cellular, individual, and population level for many different taxa scale like this. Peters, Ecol. Implications of Body Size, (1983); Savage et al., Func. Eco. 2004
Questions About Previous Studies Why plot data in this way? What are the correct transforms and combinations of data to plot? What can we learn from plot besides just strength of correlation and at most direction of trend? Why ignore information about curvature and slope? What does this mean in the context of specific theories/hypotheses for the function of sleep? What does this mean in the general context of inter-species comparisons and allometric scaling? Sleep times are highly unusual and scale differently than other biological times. Exponent not only has different value but also different sign (direction)!
Rest for the body or brain. Protection from overheating. Repair for the body or brain. Elimination of memories or reduction in synaptic strength from the day. Neural reorganization for processing memories and learning. Unlikely because very little energy is saved during sleep (about one frankfurter bun’s worth or energy). Theories for Sleep Function Rates of heating and cooling should depend only on metabolic rate and size of brain, both which scale like Mb2/3 orMb3/4. Thus, time awake and asleep should both increase with brain size in the same way, and fraction of time asleep should be invariant, so sleep time per day should be independent of brain and body mass.
Questions About Previous Studies Why plot data in this way? What are the correct transforms and combinations of data to plot? What can we learn from plot besides just strength of correlation and at most direction of trend? Why ignore information about curvature and slope? What does this mean in the context of specific theories/hypotheses for the function of sleep? Different theories lead to different predictions for direction of trend and exact value of slope. Potentially provides strong tests to distinguish among theories. 4. What does this mean in the general context of inter-species comparisons and allometric scaling?
Metabolic Activity Related to Sleep Assume that body attempts to repair damage or reorganize neural connections for learning and memory at rate set by cellular metabolic rate Bc Amount of damage (Rate of sensory input) Amount of repair (Rate of processing) tA-awake time, tS-sleep time PR-repair or reorg. power density, Vc-cell volume Savage and West, PNAS (2007)
power density for repair or reorg. repair or reorg. efficiency negative of scaling exponent for mass-specific metabolic rate of body Exact Predictions body mass OR brain awake time brain brain sleep time brain damage rate of sleep relative to wake (or relative reorg. rates) scaling coefficient tissue density power given to damage during waking or power for processing information Savage and West, PNAS (2007)
Brain Mass Scales Non-Linearly with Body Mass! Pagel and Harvey, Am.Nat. (1988)
Brain Has Nearly Autonomous Vascular System We predict it will follow the aforementioned scaling theory just by itself, so for brain metabolic rate and for brain physiological times Savage and West, PNAS (2007)
Sleep Scaling Repair (or reorganization) process is at local/molecular level, so PRis constant, and also is constant and is negligible for all but small mammals Whole Body Brain or Neurons have a high metabolic rate and essentially are never replaced. Their connections are changed. Savage and West, PNAS (2007)
Why plot data in this way? What are the correct transforms and combinations of data to plot? Plot LOG of RATIO of sleep time to awake time vs. LOG mass 2. What can we learn from plot besides just strength of correlation and at most direction of trend? Why ignore information about curvature and slope? Different slopes (exponents) correspond to different theories and different tissues where action takes place 3. What does this mean in the context of specific theories/hypotheses for the function of sleep? 4. What does this mean in the general context of inter-species comparisons and allometric scaling? Questions About Previous Studies
Body Mass Dependence 95% CI: -0.21, -0.11 Savage and West, PNAS (2007)
Brain Mass Dependence 95% CI: -0.28, -0.14 Savage and West, PNAS (2007)
Body exp.~-3/16, Brain exp.~-1/4, ~1/3 Results
Conclusions • A framework for predicting sleep times can be constructed and leads to predictions for slopes of plots. • Theories such as protection from overheating, rest, etc. can be eliminated • Sleep is a process driven by brain’s metabolic rate and mass • Sleep times scale in opposite way to most biological times • Sleep is either counteracting the secondary byproducts of the primary, beneficial function of metabolism or it is processing/reorganizing inputs as dictated by metabolic rate
Collaborators Geoff West (Santa Fe Institute and Los Alamos) James Brown (U of New Mexico) James Gillooly (U of New Mexico) Woody Woodruff (Los Alamos) Drew Allen (U of New Mexico) Eric Charnov (U of New Mexico) Alex Herman (UC San Francisco) Tony Dell (James Cook University) Jon Norberg (Stockholm University) Colleen Webb (Colorado State University) Eric Deeds (Harvard Medical School)