Download
1 / 29
290 likes | 380 Views
Discover how NetMap's Wood Modeling Tools aid in assessing wood supplies and habitat conditions for better land management practices. Explore the importance of large woody debris, wood sources, and stand treatments at different scales.

E N D
Wood recruitment modeling in NetMap(or how to see the wood for the trees) Sam Litschert & Lee Benda Earth Systems Institute Mount Shasta / Seattle / Fort Collins
NetMap Analysis Tools developed with collaborators Watershed Processes -erosion/sediment supply -LWD supply -thermal loading/temp Aquatic habitat indices -intrinsic potential (species) -core areas -connectivity -diversity -floodplains -bio-hotspots -classification USFS EPA Vegetation -forest age -fire risk -burn severity Roads -density (multi-scale) -X w/fish -upstream hab. length/quality -stability -drainage diversion -surface erosion Query/Overlap tools & others -menu driven: search & prioritize e.g., high erosion w/best habitat, high road density + high erosion + sensitive habitat NOAA Wild Salmon Center
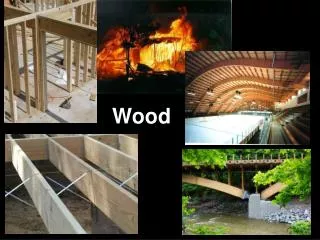
Wood in streams • Legacy of management that reduced supplies of large woody debris • Functional importance of wood: • create aquatic habitat, • provide nutrients, • channel morphology and sedimentation, • Processes that can provide wood are wildfire, insect, disease, wind, mass wasting, and suppression mortality • And now, thinning and tipping. Harmon et al, 1986; FEMAT, 1993; Meleason et al, 2003
Multi-scale wood modeling in NetMap • Reach scale • Per 100m reach or project • For selected piece sizes • Temporally and spatially explicit • Up to 3 stands on each bank • Plots of volume and number of pieces • Watershed scale • Temporally and spatially explicit • CE analysis of management scenarios • Based on RSWM technology • Plots and maps available
Reach Scale Wood Model (RSWM) • Mortality types include suppression, fire, insect, disease, & wind-throw. • Bells and Whistles: • channel width, • stand width, • hillslope gradient, • bank erosion, • wood decay, • taper equations, • thinned trees that are tipped, and • size of resulting wood pieces • Inputs: stand tables from forest growth models • Outputs: 10 types of plots Stream reach Forest stands Forest stands Stand widths Channel width Hillslope gradients Kozak, 1988; Bilby et al, 1999; Benda and Sias 2003; Sobota et al, 2006; Hibbs et al, 2007; and more.
RSWM Scenarios • Left bank is always no action scenario (70 m) • Right bank treatment scenarios (11) • Double entry thin, 70 TPA: 2010, 2040 • All other parameters held constant
Scenarios with tipped trees produce higher volumes of wood in the reach than untreated or thinned stands for most of the time simulated. The buffer reduces the effect of the thin and tip by reducing loss of wood. But in the long term the volume of wood in the stream increased to close to the untreated scenario.
Year = 2010 • 1st thin • RSWM was run to 70m on both banks, trees are too small to contribute beyond 26m from reach • Untreated stands contributed no wood in 2010
Total volume of cumulative wood over time(sorted by increasing volume) Tree tipping from thinning operations combined with riparian buffers offer the highest volumes of wood loadings
Watershed Scale Wood Model Stand tables from forest growth models (FVS, Organon and Zelig) pre-processed in RSWM Tabular data integrated with GIS: stream reaches, stands, and DEM Generate output: plots and maps
Stand information Watershed area = 5 km2 Coho and steelhead habitat Km
Stand treatments – thin to 70 TPA from the bottom(47% of watershed thinned)
Stand treatments – no action buffer & thin(39% of watershed thinned)
Wood volume (or number of pieces) sources for no action, year = 2065 Low High Stand tables not available for all locations, no wood recruited, or pieces too small Volume per length per year
Comparison of wood volume for no action and thinned buffers Wood volume
Wood volume by time (m3 100m-1 yr-1)Thinned 2015 No action buffer Thinned buffer 1995: high initial mortality – FVS model parameters? 2015: thinned 2025 – 2085: no action buffer produces more wood 2095+ : thinned buffer scenario produces more wood Only one stand had data to 2295, others ended at 2195, hence the low values after 2195
Wood volume by piece size and time (m3 100m-1 yr-1), thinned 2015 No action buffer Thinned buffer Thinned buffers resulted in a 15% decrease in wood volume
Percent changes in wood volume by piece size (cm) from no action to thinned buffer Decrease in wood of smaller sizes Increase in wood of larger sizes
Applications for land management • Multi-scale: reach or project scale v. watershed scale management and analysis; • Enables spatially variable approach and analysis; • Designs for riparian treatments – thinning, buffers, habitat; • Designs for mitigation, enhancement, tree tipping
Acknowledgements and thanks to:USFS-PNW, Gordon Reeves, Stu Johnston, Jack Sleeper, and Dan Millernetmaptools.orgearthsystems.net
Cumulative wood volume over time Cumulative wood volume by distance to stream of source trees For first and second thin treatments Total cumulative wood volume summed for each scenario Results
Wood number of piecesYear = 2065 Low High
Frequency of Wood volume No action Thin Volume (m3 100m-1 yr-1) Volume (m3 100m-1 yr-1)
What is NetMap and Why would I want to use it? • Comprised of integrated tools and geospatial data • Standardized GIS data is ready to analyze • Applies science-based models • Built on existing technologies • Developed through collaborative relationships • Increasing area for planning means more time spent on analysis • Overlapping agency jurisdictions • Similar questions, data and analysis needs (Life without NetMap ;-)
Integrated NetMap Components NetMap data Universal digital landscapes DEM-derived streams ~100 stream attributes NetMap tools Channel geomorphology Riparian management Aquatic habitat Basin hydrology Erosion Roads Vegetation NetMap coverage S.E. Alaska and British Columbia Completed Pending Help Indexed and searchable Online videos Webinars available One-on-one Western US
Legal challenges to CEs analyses • CEs analyses did not account for disturbances over time; • Models were not sufficiently evaluated with measured data; and • Model assumptions were inadequately disclosed. From reviews by Smith, 2005; Reid, 2006
Cumulative Watershed Effects (CEs) • The physical and ecological effects that result from multiple land use disturbances over space and time; • Land managers may be required to: • Compare the CEs of different forest management scenarios, and • Account for “past, present, and reasonably foreseeable future” impacts; • Which management scenario results in more CEs? • Watershed • Streams • Treatment polygons CEQ, 1997