Download
1 / 9
90 likes | 321 Views
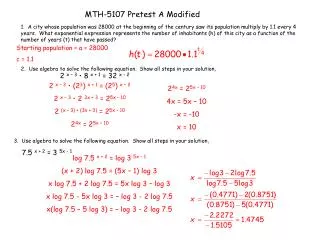
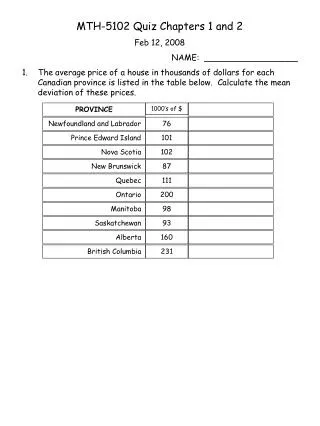
Distribution. x i. s. Z. A B C. 68 1232. 14 5.1. 0.4 -0.61. 76 1228 21.2. MTH-5102 Pretest A. a) Tania has been submitted to an admission test in a program of excellence. Her standard score is 3.0 and her mark is 82%. The group’s standard deviation was 11.3%.

E N D
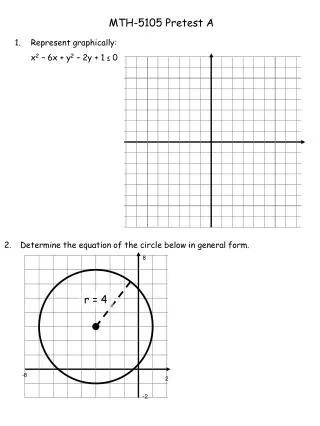
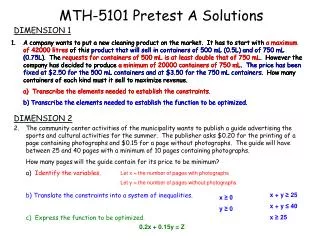
Distribution xi s Z A B C 68 1232 14 5.1 0.4 -0.61 76 1228 21.2 MTH-5102 Pretest A • a) Tania has been submitted to an admission test in a program of excellence. Her standard score is 3.0 and her mark is 82%. The group’s standard deviation was 11.3%. • What is the arithmetic mean of the group? b) Complete the following table. • Marilyn and Carol-ann have passed the same exam in 2 different groups. The standard score has been calculated for each. As a result, Carol-ann’s standard score is lower than that of Marilyn, even if they obtained the same result on the exam. • a) If the mean is the same in the 2 groups, in which group do we find the smallest standard deviation? (Explain) • b) If the standard deviation is the same in the 2 groups, which group shows the lowest mean? (Explain)
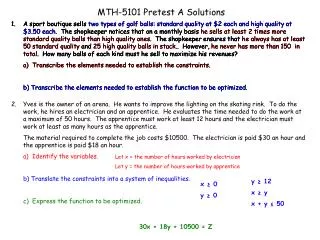
Candidate Mark Mean of the Group Group’s Standard Deviation Francis 90 78 8 Laurence 86 76 6 Gabrielle 78 62 9 Vincent 76 60 7 390 410 Mark A 380 400 380 390 450 440 390 420 400 390 Mark B 420 430 430 430 435 450 450 460 460 460 460 450 • Before concluding a transaction for the street lights of a city, the municipal engineer is doing a test on a sample of 12 lights of Brand A and Brand B. The life span in hours of the lights resulted as follows: • a) Calculate the mean life span and the standard deviation of the 2 brands. • b) If the standard deviation is the same in the 2 groups, which group shows the lowest mean? (Explain) • The members of a selection committee are verifying the files of four candidates for an accounting position. The are from the same CEGEP but are a part of four different groups. • In the table below, we indicate the mark of each candidate as well as the mean and standard deviation of the group they belong to. In which order will the committee consider the applications if they first consider the Z-score of the candidates? Show your work.
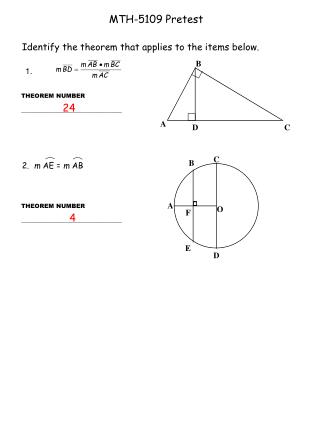
Graph 2 Graph 1 Body Mass Index Number of Bumps on the Head Age of an adult Age of an adult Graph 3 Graph 4 Difference to Life Expectancy Difference to Life Expectancy Age of an adult Age of an adult • Each of the graphs below represents the correlation between the age of an adult and a variable. Which of the following choices orders these graphs according to the strongest correlation? A) Graph 1, graph 2, graph 4, graph 3 B) Graph 1, graph 3, graph 4, graph 2 C) Graph 3, graph 1, graph 2, graph 4 D) Graph 3, graph 1, graph 4, graph 2
Mass vs Gas Consumption 18 16 14 12 10 8 Gas Consumption (L/100 km) 1000 1100 1200 1300 1400 1500 1600 1700 mass (kg) • Match the correlation coefficients to the corresponding situations. • A) A weak correlation exists between the number of hours passed in front of a TV set in a week and people’s age. We notice a small tendency to spend more time in front of the TV among older people. • B) No correlation exists between the number of centimeters of snow that falls during a winter and the number of centimeters of rain that falls during the summer. • C) A moderate correlation was determined between the average number of hours passed to study each day and the general average of marks on the reports. This correlation indicates a certain improvement on the general average when the number of hours in study increases. • 1. r = -0.68 2. r = -0.45 3. r = 0 4. r = 0.45 5. r = 0.68 • The following scatter plot represents the relation between the mass and the consumption of gas for 15 cars. Using the rectangle method, estimate coefficient of linear correlation between the mass and the gas consumption of the cars.
Relation between Health Factor and Heartbeat 140 120 Heartbeat 100 80 70 38 43 48 53 58 63 68 73 Health Factor • Specialists have analyzed the relation between the health factor of a person and his heartbeat recorded during a fairly intensive physical activity. The data collected are presented below: a) Using the median-median line method and the scatter plot, determine an approximation of the equation of the regression line. b) According to the linear model obtained, what would be the health factor of a person whose heart beat is 75?
Box of Cookies Box A Box B Box C Box D Box E Box F Box G Box H Box I Box J Box K Box L Box M Box N Fat (%) 15 21 12 18 36 39 9 24 33 30 6 42 3 27 Sodium (mg) 16 14 18 10 6 2 12 10 2 8 16 2 22 4 Cholesterol (mg) 8 9 6 6 12 12 6 10 9 8 7 11 5 9 • Magalie is doing research on the amount of fat, sodium and cholesterol found in 14 different boxes of chocolate cookies. • She presents the results of her research in the following table: From this information, what is the degree of correlation between the amount of cholesterol and the amount of sodium contained in these 14 boxes? Justify your answer. A) Moderate and positive B) Moderate and negative C) Strong and positive D) Strong and negative
IQ 99 121 123 122 118 123 100 104 127 106 108 123 104 Math mark 65 45 39 50 39 45 34 75 61 64 42 40 50 Music mark 48 68 61 55 38 35 52 65 48 60 75 68 55 • The following table shows the IQ, Math mark and Music mark for 13 students in a school. Is there a correlation between the IQ and either of the marks. • A statistical analysis of the data gives us the following results: • Between the IQ and the Math mark: r = 0.589 • y = 0.4826x + 89.6 • Between the IQ and the Music mark: r = 0.2939 • y = 0.25x + 99.4 • Can we conclude that the marks obtained I Math and Music offers a good evelaution of the intelligence quotient of a student? Explain. • If Carl has 48 in Math and 62 in Music, which model will he choose to obtain the best IQ.
Ice-time (min) 18 17 11 23 22 21 18 13 18 12 18 Points 2 1 0 3 4 2 1 0 1 1 2 • A hockey player wants to know if there’s a link between the number of minutes of ice-time and the number of points that he achieved. The table below lists the numbers for the last 11 games that he played. • a) From the data, can the player predict the points that he will score if he knows how much ice-time that he will get? • b) According to the regression line, how much ice-time must he get to score at least 1 point? • c) Is it realistic to use this linear model to make this prediction?
YEARS Speed Record (km/h) 1890 24 1200 SPEED (km/h) 1900 120 1920 165 1000 1930 380 1940 502 1960 584 800 1980 961 1990 1048 600 1999 1208 400 200 1890 1910 1930 1950 1970 1990 YEARS 12. The table and the graph below presents 9 car speed records established over 109 years of the history of the car. a) Establish and qualify the statistic relation between the speed record and the year. b) From the regression line, determine the speed record established in 1974.