Download
1 / 1
10 likes | 100 Views
Explore the innovative 4D Cluster Visualization technique allowing interactive cine-type animations for detailed analysis of intricate flow patterns in abdominal and brain images. Learn about the software's distributed computing capabilities and potential for real-time interaction with entire time series on commodity PC hardware. Harness the power of multimedia visualization for improved diagnostic evaluation.

E N D
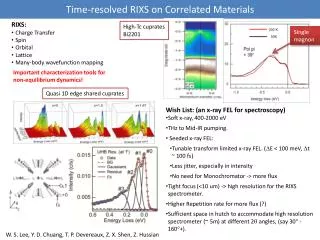
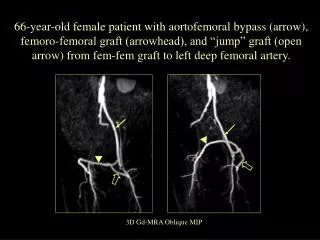
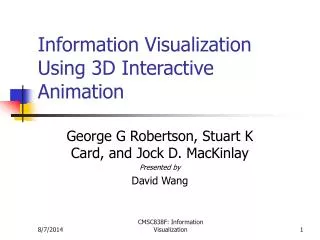
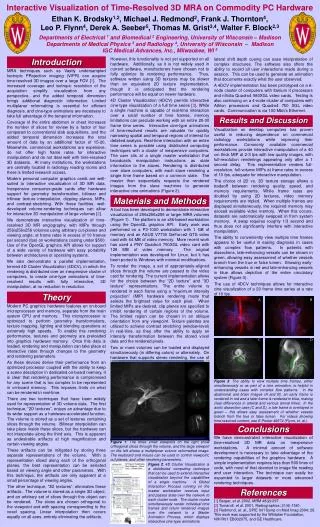
A B C D Figure 3: The ability to view multiple time frames, either simultaneously or as part of a cine animation, is helpful in understanding cases with complex flow patterns. In the abdominal and brain images (A and B), an early frame is rendered in red and a later frame is rendered in blue, making clear differences in arterial and venous arrival times. In the aortic dissection case (C and D), a late frame is overlayed in green – this allows easy assessment of whether vessels branch from the true or false lumen. For videos showing time-resolved content, see E-Poster #2574 (Flynn, et. al.). Figure 1: The three small viewports on the right show orthogonal slices through the volume, and the large viewport on the left shows a multiplanar volume reformatted image. The keyboard and mouse can be used to control viewpoint, cut planes, and other rendering parameters. Figure 2: 4D Cluster Visualization is a distributed computing technique that can be used to extend interactive visualization beyond the capabilities of a single machine. A Global Interaction Process running on the master workstation receives input and passes state over the network to each cluster node. The cluster nodes simultaneously render individual time frames and return rendered images over the network to a Master Animation Process, which displays interactive cine-type animations. Interactive Visualization of Time-Resolved 3D MRA on Commodity PC Hardware Ethan K. Brodsky1,2, Michael J. Redmond2, Frank J. Thornton4, Leo P. Flynn4, Derek A. Seeber5, Thomas M. Grist3,4, Walter F. Block2,3 Departments of Electrical 1 and Biomedical 2 Engineering, University of Wisconsin – Madison Departments of Medical Physics 3 and Radiology 4, University of Wisconsin – Madison IGC Medical Advances, Inc., Milwaukee, WI 5 Introduction However, this functionality is not yet supported on all hardware. Additionally, as it is not widely used in current software, manufacturers have chosen not to fully optimize its rendering performance. Thus, software written using 3D textures may be slower than an equivalent 2D texture implementation, though it is anticipated that the rendering performance will be equal on newer hardware. 4D Cluster Visualization (4DCV) permits interactive cine-type visualization of a full time series [3]. While a single machine is capable of real-time interaction over a small number of time frames, memory limitations can preclude working with an entire 20-30 frame time series. Interactive cine-type animations of time-resolved results are valuable for quickly narrowing spatial and temporal regions of interest for detailed analysis. Real-time interaction with an entire time series is possible using distributed computing techniques with a cluster of inexpensive computers. The user sits at a single master workstation that broadcasts manipulation instructions as state information to the slaves. Rendering is distributed over slave computers, with each slave rendering a single time frame based on a common state. The master then sequentially requests the rendered images from the slave machines to generate interactive cine animations (Figure 2). lateral shift depth cueing can ease interpretation of complex structures. The software also offers the ability to record all user interactions made during a session. This can be used to generate an animation that documents exactly what the user observed. A 4DCV implementation has been prototyped on a 6-node cluster of computers with Itanium II processors and nVidia Quadro4 980XGL video cards. Testing is also continuing on a 4-node cluster of computers with Athlon processors and Quadro4 750 XGL video cards. Communication is via 100 Mbit/s Ethernet. MRA techniques such as Vastly undersampled Isotropic PRojection imaging (VIPR) can acquire time-resolved 3D images over a large FOV [1]. The increased coverage and isotropic resolution of the acquisition simplify visualization from any perspective, and the added temporal dimension brings additional diagnostic information. Limited multiplanar reformatting is essential for efficient diagnosis, and cine-type animations are necessary to take full advantage of the temporal information. Coverage of the entire abdomen or chest increases the number of slices for review by a factor of four compared to conventional slab acquisitions, and the added temporal dimension increases the total amount of data by an additional factor of 15-20. Meanwhile, commercial workstations are expensive, do not offer high frame rates for interactive manipulation and do not deal well with time-resolved 3D datasets. At many institutions, the workstations are centrally located in radiology reading rooms and there is limited research access. Modern personal computer graphics cards are well-suited to interactive visualization of 3D MR data. Inexpensive consumer-grade cards offer hardware support for geometry transformation, bilinear and trilinear texture interpolation, clipping planes, MIPs, and contrast-stretching. With these facilities, well-developed volume-rendering techniques can allow for interactive 3D manipulation of large volumes [2]. We demonstrate interactive visualization of time-resolved 3D MR angiography, with MIPs through 256x256x256 volumes using arbitrary cut-planes and viewing angle, at frame rates in excess of 10 frames per second (fps) on workstations costing under $500. Use of the OpenGL graphics API allows for support of a wide variety of hardware with easy portability between architectures or operating systems. We also demonstrate a parallel implementation, termed 4D Cluster Visualization (4DCV), in which the rendering is distributed over an inexpensive cluster of computers, to create cine-type animations of time-resolved results with fully interactive, 3D manipulation, at no reduction in resolution. Results and Discussion Visualization on desktop computers has proven useful in reducing dependence on commercial radiology workstations while improving their performance. Commonly available commercial workstations provide interactive manipulation of a 40 cm thick MIP at 2-3 fps with low quality images, with full-resolution renderings appearing only after a 1 second delay. This implementation renders full-resolution, full-volume MIPs at frame rates in excess of 10 fps, adequate for interactive manipulation. The choice of 2D vs. 3D texture storage allows a tradeoff between rendering quality, speed, and memory requirements. While frame rates are doubled by using 2D textures, video memory requirements are tripled. When multiple frames are displayed simultaneously, the required memory may exceed available video memory. When this occurs, datasets are automatically swapped in from system memory. A swap requires roughly 1/3 second and thus does not significantly interfere with interactive manipulation. The ability to conveniently view multiple time frames appears to be useful in easing diagnosis in cases with complex flow patterns. In patients with dissections, late-enhancing vessels can be shown in green, allowing easy assessment of whether vessels branch from the true or false lumen. Showing early-enhancing vessels in red and late-enhancing vessels in blue allows depiction of the entire circulatory system (Figure 3). The use of 4DCV techniques allows for interactive cine visualization of a 20 frame time series at a rate of 10 fps. Materials and Methods A tool has been developed to demonstrate interactive visualization of 256x256x256 or larger MRA volumes (Figure 1). The platform is an x86-based workstation using the OpenGL graphics API. Early work was performed on a P3-1000 workstation with 1 GB of memory and an ASUS V7700 GeForce2 GTS video card with 64 MB of video memory. More recent work has used a PNY Quadro4 750XGL video card with 128 MB of video memory. The original implementation was developed for Linux, but it has been ported to Windows with minimal modifications. To render the image, a set of appropriately-aligned slices through the volume are passed to the video card for rendering. The current implementation allows for the choice between the “2D texture” and “3D texture” representations. The entire volume is rendered in each frame using a “maximum intensity projection” (MIP) hardware rendering mode that selects the brightest value for each pixel. When limited MIPs are desired, clip planes are specified to inhibit rendering of certain regions of the volume. The limited region can be chosen in an oblique orientation from any viewpoint. Texture palettes are utilized to achieve contrast stretching (window-level) in real-time, as they offer the ability to apply an intensity transformation between the stored voxel data and the rendered pixels. Two or more volumes can be loaded and displayed simultaneously (in differing colors) or alternately. On hardware that supports stereo rendering, the use of . Theory Modern PC graphics hardware features an on-board microprocessor and memory, separate from the main system CPU and memory. This microprocessor is optimized to perform geometry transformations, texture mapping, lighting and blending operations at extremely high speeds. To enable this rendering performance, textures and geometry are preloaded into graphics hardware memory. Once this data is loaded, rendering and manipulation can take place at interactive rates through changes to the geometry and rendering parameters. As these devices derive their performance from an optimized processor coupled with the ability to keep a scene description in dedicated on-board memory, it is clear that rendering performance is compromised for any scene that is too complex to be represented in on-board memory. This imposes limits on what can be rendered in real-time. There are two techniques that have been widely used for representation of 3D volume data. The first technique, “2D textures”, enjoys an advantage due to its wider support as a hardware-accelerated function. The volume is stored as a set of textures containing slices through the volume. Bilinear interpolation can take place inside these slices, but the hardware can not interpolate along the third axis. This is apparent as undesirable artifacts at high magnification and certain viewing angles. These artifacts can be mitigated by storing three separate representations of the volume. With a representation sliced along each of the orthogonal planes, the best representation can be selected based on viewing angle and other parameters. With this technique, the artifacts are only apparent at a small percentage of viewing angles. The other technique, “3D textures”, eliminates these artifacts. The volume is stored as a single 3D object, and an arbitrary set of slices through this object can be rendered. The slices are chosen orthogonal to the viewpoint and with spacing corresponding to the voxel spacing. Linear interpolation then occurs equally on all axes, entirely eliminating the artifacts. Conclusions We have demonstrated interactive visualization of time-resolved 3D MR data on inexpensive workstations. A minimal amount of software development is necessary to take advantage of the rendering capabilities of the graphics hardware. A simple implementation requires less than 500 lines of code, with most of that devoted to image file reading and user interaction. The technique can easily be expanded to larger datasets or more advanced rendering techniques. References [1] Barger, et al. 2002, MRM 48(2):297. [2] Tomandl, et al. 2001, Radiographics; 21(6):1561. [3] Redmond, et. al., SPIE Int’l Symp on Med Imag 2004; 28. This work was supported by the Whitaker Foundation, NIH R01 EB002075, and GE Healthcare.