Download
1 / 24
240 likes | 412 Views
Evaluation of WRF Using High-Resolution Soil Initial Conditions from the NASA Land Information System. University of Maryland WRF Workshop, 14 September 2007 Presented by: Jonathan L. Case. Project overview / Hypothesis Experiment design Results Land Information System vs. Eta comparison

E N D
Evaluation of WRF Using High-Resolution Soil Initial Conditions from the NASA Land Information System University of Maryland WRF Workshop, 14 September 2007 Presented by: Jonathan L. Case • Project overview / Hypothesis • Experiment design • Results • Land Information System vs. Eta comparison • Impacts on short-term numerical forecasts • Summary / Future Work
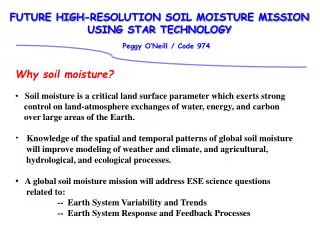
Project Overview • Hypothesis: Can short-term mesoscale numerical forecasts of sensible weather elements be improved by using optimally-tuned, high-resolution soil fields? • Project Goals: Investigate and evaluate the potential benefits of using high-resolution land surface data derived from NASA systems and tools on regional short-term numerical guidance (024 hours) • Use LIS software to initialize soil temperature and moisturein the WRF model • Examine one month period with relatively benign weather • Isolate influence of land-atmosphere interactions • May 2004 over Florida peninsula
Experiment Design • LIS offline simulation using Noah LSM • Nested 9-km/3-km grid domain over SE U.S. • Simulation from 1 May 2002 to 1 June 2004 • Output every 12 hours during May 2004to initialize WRF runs • Atmospheric forcing datasets • North American Land Data Assimilation System (NLDAS; hourly, ~14 km) • Global Data Assimilation System (GDAS; 6-hourly, ~52 km) • GDAS used where NLDAS forcing is missing • Compare regional WRF simulations with high-resolutionLIS soil data to WRF runs with Eta model soil data • Calculate verification statistics at 80 surface stations • Plot fields to compare phenomenology differences
9-km 3-km Control WRF and LIS/WRF Configuration • Common characteristics • Nested grids: 9-km and 3-km spacing • Noah LSM • Daily 24-hour forecasts during May 2004 initialized at 0000 UTC and 1200 UTC • Atmospheric initial & boundary conditions from NCEP Eta model on 40-km grid • Differences • Control WRF: Initial soil data from Eta model • LIS/WRF experiment: Initial soil data from 2+ year LIS run on exact WRF grids
Daily 0-10 cm initial soil moisture (%)(0000 UTC values during May 2004) Eta soil moisture LIS soil moisture Difference (LIS – Eta)
Daily 0-10 cm initial soil moisture (%)(0000 UTC values during May 2004) Eta soil moisture LIS soil moisture • Much more detail in LIS (as expected) • LIS drier, especially over N. FL & S. GA • LIS slightly more moist over Everglades Difference (LIS – Eta) LIS Substantially Drier
Daily 0-10 cm initial soil temperature (°C)(0000 UTC values during May 2004) Eta soil temperature LIS soil temperature • LIS systematically cooler over most of domain Difference (LIS – Eta)
0-10 cm initial soil moisture (%)(1200 UTC 6 May 2004) Eta soil moisture LIS soil moisture Difference (LIS – Eta)
Sample Sea Breeze Evolution Differences(9-hour forecast valid 2100 UTC 6 May)
Sample Sea Breeze Evolution Differences(10-hour forecast valid 2200 UTC 6 May)
Sample Sea Breeze Evolution Differences(11-hour forecast valid 2300 UTC 6 May)
Sample Sea Breeze Evolution Differences(12-hour forecast valid 0000 UTC 7 May)
Sample Sea Breeze Evolution Differences(Meteogram plots at 40J and CTY)
Verification Stats: 0000 UTC Cycle(29 forecasts @ 80 surface stations) • LIS/WRF runs reduced RMS errors by a few tenths of a degree over most forecast hours • Nocturnal warm bias and daytime cold bias both improved • Not much change in dewpoint verification stats • LIS/WRF daytime dewpoints about 0.5°C lower than control WRF • Wind Speed (not shown): LIS/WRF improved nocturnal high bias
Summary / Preliminary Conclusions • Configured and tested LIS/WRF on Florida case • Initial soil fields generated on exact WRF grids • LIS generated soil fields cooler and drier than Eta model • Simulated atmosphere sensitive to changes in soil characteristics provided by LIS • Demonstrated positive improvement in sea-breeze prediction on 6 May • Improvements in diurnal prediction of 2-m temperatures during whole month (both 0000 and 1200 UTC forecast cycles)
Proposed Future Activities with LIS/WRF • Merge MODIS sea-surface temperatures with LIS soil data • Study impacts of LIS soil data on convective initiation • Different regional domains & cases • Varying weather regimes (e.g. supercells vs. air-mass storms) • New case study period over Tennessee Valley • Very warm March followed by killing freeze in early April 2007 • Use real-time MODIS greenness fraction products in LIS/WRF system • Regional modeling ensembles • Summertime forecast sensitivity to soil initial condition perturbations • Run different LSMs within LIS/WRF for ensemble members • Pathway to operational regional LIS/WRF runs
Alabama Freeze Case: April 2007 • Proposal: • Use real greenness fraction data in LIS/WRF simulations, derived from MODIS vegetation index composite products • Measure impact on WRF forecasts compared to climo datasets
Soil Moisture: Grid-Wide Stats; Land Points • LIS is a few % drier than Eta model in volumetric soil moisture • Variation about mean is very similar to Eta model soil moisture
Soil Temp: Grid-Wide Stats; Land Points • LIS 0-10 cm soil temperatures typically cooler than Eta at 00z • LIS 0-10 cm soil temperatures about the same or slightly warmer at 12z • LIS deeper soil temperatures consistently colder than Eta
Sample Sea Breeze Evolution Differences(Forecasts from 1200 UTC 6 May Simulations)