Setting Effective Targets for Post-16 Student Progress in Sixth Form
This document aims to assist senior leaders and heads of sixth form in establishing benchmarks for tracking the progress of post-16 students. It outlines national targets for student achievement from 2006 to 2015, highlights essential data sources like PANDA, LAT, FFT, and ALIS, and presents various measures for setting and evaluating student performance over time. The emphasis is on value-added assessment, contextual information regarding student demographics, and the implementation of a robust framework for improving educational outcomes in sixth forms.


Setting Effective Targets for Post-16 Student Progress in Sixth Form
E N D
Presentation Transcript
Target Setting in the Sixth Form Pete Bull, Eileen Chapman Senior School Improvement Advisers School Improvement Service Contact: pbull@cfbt.com Tel: 07818 034504
Aim To assist senior leaders / heads of sixth form in the setting of targets for and tracking the progress of post-16 students.
National Targets 2006 70% achieve L2 by 19 (baseline in 2004 was 67%) 2008 72% achieve L2 by 19 75% increase in completion of young apprenticeships 2011 2% reduction in NEET 2015 90% of 17 yr olds participate in education
What Data? • Post 16 PANDA • Learner Achievement Tracker (LAT) (part of the LSC’s new measures for success) • FFT online • ALIS (A level Information system) • ALPS (A level points system) Two functions: • Recording and reporting what has already been done • Setting targets for future cohorts
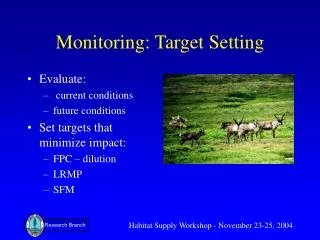
Value-added target setting Average Points Score for En, Ma, Sc at KS2 Points score for subject at KS3 KS2-3 KS2-4 Points score for subject at KS4 Average Points Score for En, Ma, Sc at KS3 KS3-4 Average Total Points Score up to 2 years before Post-16 measure (not re-sits) KS4-5 Points score for L3 subject at KS5
Post-16 PANDA • Contextual information about numbers and genders • Attainment Summary - %A-E, APS per entry (all and gender using UCAS) compared with national. Sig+, in line, sig – • New measures of success at L3 – VA score (QCA) compared with national
Learner Achievement Tracker • Value-Added for 16-19 learners will measure achievement in L3 graded qualifications, for example: • GCE A and AS level • AVCE • BTEC National Diploma • Distance Travelled for 16-19 learners will include other approved Qualifications at Levels 1,2 and 3 for example: • NVQ • Foundation and Intermediate GNVQ • GCSE
VA summary chart 0 = national average +30 = one grade better
VA comparison chart A A* C B D
National Chances chart Prior attainment 40-46 points at GCSE (C – B/C)
Update on Post-16 Achievement and Attainment Tables Pilot Overview • 2 Year Pilot - 2005 and 2006 • Long term aim of reporting all Level 3 qualifications and including a value added measure in the Post-16 Tables • Year 1 (2005) – Testing Equivalences between A/AS and other qualifications • Year 2 (2006) – Testing Value Added (more difficult process)
QCA Scoring system Size compared with Level 3 Threshold - 2 A levels
Normal Post-16 AAT 2005 Number of students aged 16-18 287 GCE and VCE resultsNumber entered 128Average point score per student 244.3 (3C)Average point score per examination entry 78.4 (C)Other QualificationsNumber of students entered for an AEA 2005% achieving qualificationNumber of students entered for other Advanced VQ% achieving qualificationNumber of students entered for Intermediate VQ% achieving qualificationNumber of students entered for IB diploma 13% achieving IB diploma 92%
Pilot AAT 2005 Contextual InformationNumber of 16-18 yr olds 287Number of 16-18 yr olds at end of A-level study 128Number of 16-18 yr olds at end of A-level & equiv’t study 141 SCAAT Performance IndicatorsQualifications achieved by students at end of A-level/6th Form studyAverage points per candidateA/AS/Key Skills only (UCAS points) 244.3 (3C)A/AS/Key Skills only (QCA points) 636.4 (3C)A/AS & Equivalences (QCA points) 661.6 (3C+)Average points per A-level equivalentA/AS/Key Skills only (UCAS points) 78.4 (C) (A/AS/Key Skills only (QCA points) 204.2 (C-)A/AS & Equivalences (QCA points) 201.0 (C-)
For 2006 • All L3 qualifications • New QCA scores • APS per student + APS per entry For 2007+ • Trying to get a value-added school measure • Look at Value Added of each student at end of 6th form based on: • Prior attainment • Pupil context – e.g. gender, volume of study, qualification route
Update on Fischer Family Trust Online • A pilot looking at subject value-added comparisons from KS4 – KS4 (also KS2/3 – KS4) • Data for 2005 year for you to explore • Password: from Performance Information office - 01522 553271 (you need school DFES number e.g. 925XXX) • Website: www.fftlive.org
External forecasting systems: ALIS • A Level Information System (www.cemcentre.org) • Baseline is APS at GCSE (can use a paper test if no scores at GCSE) • Attitudinal questionnaires available – helps teaching and learning and careers • Suggested forecasts for new students – grouped into 4 quartiles based on GCSE APS (Band A: > A/B, Band B: B/C – A/B, Band C: B/C, Band D: <C) • Value-added reports after results
External forecasting systems: ALPS • Advanced Level Performance System • Website (www.alps-va.co.uk) • Baseline is GCSE prior attainment. Data sent to Alps for calculation of targets. • Data tables allow a subject to know whether their performance is at the higher, middle, or lower end of achievement when compared with the best achieving providers. • Forecasts provided as minimum target grades. These are derived from the performance of the top achieving colleges. The forecasts are intentionally demanding. • Produces benchmark tables based on value-added: