
OS13B - 0536
OS13B - 0536 Modeling the Distribution and 15 N of Nitrogen Gas and Nitrogen Species in the Black Sea S. K. Konovalov 1 , C. A. Fuchsman 2 and J.W. Murray 2

OS13B - 0536
E N D
Presentation Transcript
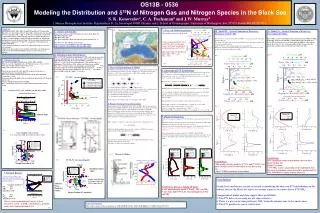
OS13B - 0536 Modeling the Distribution and 15N of Nitrogen Gas and Nitrogen Species in the Black Sea S. K. Konovalov1, C. A. Fuchsman2 and J.W. Murray2 1. Marine Hydrophysical Institute, Kapitanskaya St. 2a, Sevastopol 99000 Ukraine; and 2. School of Oceanography, University of Washington, Box 355351 Seattle WA 98195-5351 Abstract Distributions of NO3-, NO2-, NH4+, N2 and PON and their d15N values in the Black Sea were measured in order to unravel the cycling of nitrogen, especially the role of anammox (NO2- + NH4+ = N2). We have constructed a steady state coupled physical-biogeochemical model of the water column. The physical model is a vertical transport model that includes simulation of entrainment and intrusions from the Bosporus Plume. The biogeochemical model includes mass balance equations for 14N and 15N. Comparison of observations and model results show: 1. The chemical distributions can be fit by adjusting the respective reaction rate constants 2. This steady state model can not simultaneously fit the concentrations and stable isotope data without including some process that removes heavy nitrogen Fig. 1 • 10. Model #2 – Vertical Zonation of Processes: • Reactions with S, HS- • We allowed the reaction between NO3- and NH4+ to occur in the region of the NO3- gradient (Fig. 11). • The origin of the NH4+ is from regenerated PON and its concentration remains low because it is rapidly utilized. • Light 14N-NO3- would be preferentially used to make light N2. • The heavy 15N-NO3- that remains diffuses downward to be reduced by S to NH4+ in the lower layer (thus making heavy NH4+). • Fig. 11 • Fig. 12 • Conclusions: • This model correctly simulates d15N-N2 and d15N-NO3- but not d15N-NH4+ and d15N-PON which are too heavy (Fig. 12). • The d15N-NH4+ maximum is too shallow. • 11. Model #3 – Vertical Zonation of Processes: • Scavenging by MnO2 • Heavy NH4+ is removed, possibly by preferential adsorption of NH4+ by MnO2. Light NH4+ is left to react with NO2- to make light N2. The adsorbed (and heavy NH4+) is released back to the water when the MnO2 is reduced in the anoxic layer (Fig. 13). 15% of the upward flux of NH4+ is removed to the anoxic zone and the isotopic fractionation (e) required is -20‰. • Fig. 13 • Fig. 14 • Conclusion: • The simulation results in distributions close to those observed (Fig. 14). • Light N2 is made. • d15N-NH4+ reaches a maximum at the right depth, then decreases to minimum values that help to produce light N2 • The d15N-PON is similar to those observed. • 1. Cruises and Samples • Data for this study was collected during recent cruises in the Black Sea: • R/V Bilim September 2000 • R/V Knorr May 2001 • R/V Knorr April 2003 (Track and Station Locations shown in Fig. 1) • The cruise web sites with data are located at: • http://oceanweb.ocean.washington.edu/cruises/Knorr2001 • http://oceanweb.ocean.washington.edu/cruises/Knorr2003 4. Nitrogen Isotope Distributions (Fig. 5)d15N-NO3- increases to a maximum of ≈ 18‰ in the suboxic zone then decreases with depth. Above the suboxic zone values are about 8‰ which is higher than average NO3- in seawater (d15N-NO3- ≈ 4.5 to 6‰) (Fig. 6)d15N-NH4+is very low in the deepwater (≈ 2‰) and increase to a maximum of 7‰ at the base of the suboxic zone, then decrease slightly. (Fig. 7)d15N-N2in the suboxic zone maximum is extremely light (d15N-N2≈0.0‰) compared to SW in equilibrium with the atmosphere (d15N-N2 ≈ 0.7‰) and to the other forms of N that are sources for N2 (d15N-NO3- ≥ 8‰; d15N-NH4+ ≥ 8‰; d15N-PON = 2.7 to 9.0‰). • 2. Nitrogen Species • Fig. 2 shows an example of distributions of NO3-, NO2- and NH4+ • NO3- increases to a maximum at st = 15.6 then decreases to 0 at st = 15.95 • NO2- has a small maximum centered at st = 15.8 • NH4+ starts to increase at st = 15.95 • The N2/Ar data from 2000, 2001 and 2003 are plotted as the ratio of sample/saturation versus density in Fig. 3. • The water column is usually supersaturated with N2 with a maximum centered at st ≈ 16.0. • Supersaturation in the shallow layers results from upward flux of N2 from the suboxic zone. • There is significant interannual variability. • The concentrations can be reset to atmospheric saturation after intense storms. 5. Physical Biogeochemical Model We utilized a 1.5-D physical transport model (Fig. 8) that includes simulation of the Bosporus Plume and assumes isopycnal distribution of all properties (Samodurov and Ivanov, 1998; Ivanov and Samodurov, 2001). The resulting 1-D vertical balance equations can be written as: k = vertical diffusion coefficient; = diffusive flux, w = vertical velocity and wC = the advective flux occurring due to displacement of the Black Sea deep waters with the waters from the Bosporus plume, R = rate of biogeochemical production-consumption, Cb = concentration in the “Bosporus plume” C = concentration in the ambient water. The model has been verified using 137Cs data from 1986 to 2003. 6. Biogeochemical Transformations Transformations of O2, PON, DON, NO3-, NO2-, N2, NH4+, H2S, S0 and dissolved and particulate Mn(II) and Mn(IV) and Fe(II) and Fe(III) are included in the model. Dissolved organic N is split into labile (DON(L)) and refractory (DON(R) fractions. Particulate organic nitrogen is split into the fraction sinking from the euphotic zone (PON) and the fraction that is bacterially produced (PON(B)). Equations that parameterize biogeochemical transformations are written to follow either “chemical” or Michaelis-Menten kinetics. Thus, oxidation of sulfide by oxygen is parameterized as a chemical process. Microbiologically mediated processes, like oxidation of PON by oxygen are parameterized by Michaelis-Menten kinetics. The specific (k) and maximum () rates were taken from publications, when available, and adjusted to fit the data. All values of k and were assumed constant. • 8. Simulation of d15N distributions • To simulate 14N/15N fractionation, all reactions were written in terms of both 14N and 15N. The rate of 15N transformations is proportional to the rate of 14N transformations, to the ratio of [15N]/[14N], and fractionation factors a=e/1000 + 1, • where e is the isotopic enrichment factor. • Thus, the rate of oxidation of 15N-PON is • Published data on fractionation (a) or isotopic enrichment (e) factors are limited. • It is often difficult to identify, if the published values are specific for individual reactions or processes that may involve a number of reactions. • Still, the published values for the isotopic enrichment factors (e) generally vary from 0 to 40‰. • The enrichment factors (e) required to fit the data are given below: • nitrate (NO3-) reduction, for all reductants (e.g. CH2O, S)e = 25 - 30‰ • nitrite (NO2-) reduction and oxidation e = 10 - 15‰ • reactions of particulate organic nitrogen to NH4+e = 2 -5‰ • ammonium (NH4+) consumption or oxidation (e.g. Anammox) e = 0 to a few ‰ • 9. Model #1 Simulation • The model was tuned to simulate d15N profiles in the oxic and anoxic layers (Fig. 10). • The initial conditions derived from the real observations are shown as dashed lines. • Simulations are shown for 90 days, 1 year and 13 years. • Variations in a (e) for denitrification and anammox did not change the final result. • Complete consumption of NO3- (NO2-) and NH4+ does not result in any fractionation. • Steady State profiles are easily obtained for d15N-NO3- and d15N-NH4+ • but d15N-N2 decreases initially then increases rapidly. At steady state (after several decades?) the d15N-N2 must equal 8‰, much higher than the observed values of 0.0‰. • Conclusions (Doesn’t explain all data): • Can’t simultaneously model d15N of N2, NO3- and NH4+. • Can’t make light d15N-N2 by total consumption of NO3- and NH4+. Conclusion Steady State model runs are not successful at simulating the observed d15N distributions in the suboxic zone of the Black Sea unless we assume a process to remove heavy d15N-NH4+. Comparison of model and data suggest three possibilities: 1. The d15N data we are using are not representative. 2. There is a process to transport heavy NH4+ from the suboxic zone to the anoxic zone. 3. The d15N profiles are not at steady state. Acknowledgement This work is a part of the next projects: NSF MCB 0132101; NSF OCE #0081118; NATO CLG #9791211