Download
1 / 50
500 likes | 603 Views
Explore the power of GIS mapping, understand data organization, and learn about essential mapping approaches for community development. Tour a network GIS platform and discover methods for mapping supermarket access and transit convenience.

E N D
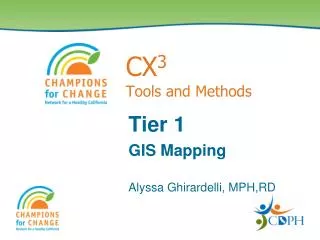
CX3 Tools and Methods Tier 1 GIS Mapping Alyssa Ghirardelli, MPH,RD
CX3Mapping Overview • The Power of Maps • Ways to Use Maps • Building Partnerships • Community Forums • Local Empowerment • Buy-in from Leadership • Elevating Action with Influential People • Collect complete and accurate data • GIS mapping is only a snapshot • Maps should not sit on the shelf- share! • GIS has many applications, CX3 only one
CX3Mapping Overview Approaches to Mapping • Map By Neighborhood • Map By Indicator Approach to mapping will inform Tier 2 field survey methods
CX3Tier 1 Data Organization & Summary • Create system to organize maps, data lists and worksheets (electronic files and hard copies) • Worksheets are worksheets • Worksheets help interpretation, find meaning for sharing information • Data from worksheets will be entered by staff in Sacramento • One page summary of data from neighborhoods will be created
CX3Mapping OverviewTour of Network GIS -GIS=Geographic Information System -Basically system to display information from database through geocoding and layers -Logging on: http://www.cnngis.org OR http://gis.cdph.ca.gov/cnn/ -Navigating the site -Areas and functions you will use -But much more to explore!
CX3Mapping OverviewTour of Network GIS -Pop up blockers -Zoom in, Zoom out, Pan -Layers, Legend, Locate -Downloading data lists -Drawing buffers -Draw point locations -Measure tool -Saving maps -Printing/manipulating maps -Using local knowledge
SNAP-Ed Census Tract Qualification <185% All R • To qualify neighborhoods by census tracts, use new ACS 2005-2009 layer: Proportion < 185%FPL All Races • Currently only have “all races” available • In 2012 proportion < 185%FPL race-ethnic layers will be made available • Can also try: • Proportion in poverty < 100% FPL by race-ethnicity • Block Group (BG) proportion < 185% FPL All Races <100% Hisp BG <185%
SNAP-Ed Census Tract Qualification • If re-assessing a neighborhood: • No need to re-qualify • Mapping and field survey data collection are evaluation • Will compare current data with previous data • If identifying new areas to map: • Neighborhoods must qualify • ACS 2005-2009 data layers • Proportion < 185% FPL All Races • Proportion in poverty < 100% FPL by race-ethnicity • Block Group (BG) proportion < 185% FPL All Races
Use of other data sources • Environmental health data • Google/Yahoo • Google street view • City crime data – variable, but emerging • Walkscore • walkscore.com • Healthy City • healthycity.org • All CA- does not include data about store for points on map
CX3Tier 1NF1- Supermarket Access • Total number of residents served by supermarkets or large grocery stores (> 20 employees and accounting for any overlap of markets) • Estimated percent of neighborhood residents served and not served • Approximate distance required to travel to supermarkets for most residents (2/3 or more)
CX3 Tier 1NF1- Supermarket Access • Identify neighborhood • Obtain population data, use Total Pop • Map “Retail Food Outlets”, “General Grocery” • Obtain supermarket data (>20 emp only) • Map ½ mile (2640 feet or .5 miles) buffer around selected stores • Determine estimate of percent of population in neighborhood served by ½ mile buffer • If no supermarkets, expand buffer to find distance required to get to one by most residents
Food Source ½ mile service area Oak Park Neighborhood
Finding Access in Food Desert1 ½miles to large grocery store • Draw Point Location • Buffer around point until large grocery found • Use return attribute data for general grocery to find
CX3 Tier 1NF1- Supermarket Access Exercise 1. Locate Neighborhood Census tracts: • 06001402600 • 06001402700 • 06001402800 • 06001402900 • 06001403000 • 06001403100 2. Map grocery stores (retail) 3. Download grocery stores 4. Find number of supermarkets w/>20 employees in neighborhood
CX3 Tier 1NF1- Supermarket Access Exercise cont. 5. One store? 6. How far do most of the residents in neighborhood need to travel to get to a large grocery store? 7. Discuss
Only serving a portion of the neighborhood • Use population data to estimate percent served • Notice highway barrier
CX3Tier 1NA2- Supermarket Access Transit • Proportion of supermarkets or large grocery stores (> 20 emp) with convenient public transit • Supermarket or large grocery store has a stop within 1 block • Frequency: No less than 30 minutes each way including evenings and weekends • Make note if poor route access through residential areas • Transit score for supermarket address • If no market in the neighborhood, expand search with buffer • Urban or older/denser suburb—2 miles • Newer suburb—5 miles • Rural—15 miles
CX3 Tier 1NA2- Supermarket Access Transit • Find transit agency(ies) • Obtain schedules and routes • Check neighborhood maps for routes w/in 1 block of supermarket • Draw routes and check schedules (can do electronically using map placed into Word) • If no supermarket in neighborhood, find closest and check transit • Find Transit Score (walkscore.com)
Food Source at 4401 Broadway, Sacramento, CA Oak Park Neighborhood Rte. 51 Rte. 83
CX3 Tier 1NA2- Supermarket Access Transit • Transit Score Available with list of routes
CX3Tier 1NF2- Markets Around Schools • Number of small markets and convenience stores within ½ mile of schools • Proportion of schools with small markets and convenience stores within ½ mile • Out of total number of schools how many have small markets and convenience stores • Highest number of small markets and convenience stores for a school within ½ mile (ie. worst case scenario)
CX3 Tier 1NF2- Markets Around Schools • Map schools • Map grocery stores and convenience (“Retail Food Channels”, “Retail Food Markets”, “General Grocery” and “Convenience Group”) • Download grocery store and convenience store data • Draw ½ mile buffer around each school • Count and record small markets (≤ 20 emp) and convenience stores within buffer around each school
CX3 Tier 1NF2- Markets Around Schools Exercise 1. Locate Neighborhood Census tracts: • 06037212410 - 06037212304 • 06037212420 - 06037212305 • 06037212303 - 06037212306 2. Map public schools, grocery stores, convenience • 3. Draw ½ mile buffer (2640 feet) around K-12 in 06037212304 4. Return attribute data for general grocery and convenience 5. How many markets w/in ½ mile w/≤ 20 employees? 6. How many convenience stores? 7. How many in qualifying census tracts?
CX3Tier 1NA7- Pedestrian Attractions • Score of amenities within a walkable distance (1 mile) from the neighborhood school – using walkscore.com • Points based on the distance to the closest amenity by category. If the closest amenity in a category is within .25 miles, the maximum number of points are assigned. The number of points declines as the distance approaches 1 mile
Walk Score Methodology (walkscore.com) Walk Score Methodology • calculates the walkability of an address based on the distance from your house to nearby amenities. Walk Score measures how easy it is to live a car-lite lifestyle—not how pretty the area is for walking. The Walk Score Algorithm • uses a patent-pending system to measure the walkability of an address. The Walk Score algorithm awards points based on the distance to the closest amenity in each category. If the closest amenity in a category is within .25 miles (or .4 km), we assign the maximum number of points. The number of points declines as the distance approaches 1 mile (or 1.6 km)—no points are awarded for amenities further than 1 mile. Each category is weighted equally and the points are summed and normalized to yield a score from 0—100. The number of nearby amenities is the leading predictor of whether people walk. How it Doesn't Work • There are a number of factors (street design, safety, etc.) that contribute to walkability but are difficult to measure with an algorithm.
CX3Tier 1NA7- Pedestrian Attractions Exercise 1. Go to walkscore.com 2. Enter the following schools to get the scores: Bobby Duke Middle School, Coachella, CA Burnett Elementary, Long Beach, CA Sunnyside High School, Fresno, CA 3. Discuss
CX3Tier 1NF7- Farmers’ Markets • Number of farmers markets in the neighborhood and if accept EBT, WIC, Senior Vouchers • If no farmers markets in neighborhood, number within 5 miles • If they accept EBT, WIC, Senior Vouchers • If have convenient public transit
CX3 Tier 1NF7- Farmers’ Markets • Map market(s) in neighborhood • Assess if accept EBT • If no farmers’ markets in neighborhood, select central location and expand buffer to 5 miles • Assess if convenient transit to market(s) within 5 miles • Obtain farmers’ market data (optional)
CX3 Tier 1NF7- Farmers’ Markets Exercise 1. Locate Neighborhood Census tracts: • 06077003404 • 06077003405 2. Map farmer’s markets 3. Is/are there a market(s) in the neighborhood?
CX3 Tier 1NF7- Farmers’ Markets Exercise cont. 4. Is/are there a market(s) with in 5 miles of the neighborhood? 5. If yes, how many? 6. Does it accept EBT? 6. How far from center point of neighborhood?
Neighborhood = 2 Census Tracts in blue Just over 1 mile from center of neighborhood Farmers’ market
CX3Tier 1NF9- Fast Food Outlets • Ratios of fast food to population • Number of outlets within 1000 ft and ½ mile to schools and parks in neighborhood • Proportion of schools/parks with fast food outlets within 1000 ft and ½ mile • Out of total number of schools how many have fast food outlets • Highest number of outlets for a school/park with fast food within 1000 ft and ½ mile (ie. worst case scenario)
CX3 Tier 1NF9- Fast Food Outlets Neighborhood Density • Map fast food outlets (“Retail”, “Eating Places”, “Fast Food, Pizza, Sandwiches”) • Download list to classify • Use census tracts population data from NF1 • Calculate the ratio of fast food outlets to the neighborhood population
CX3 Tier 1NF9- Fast Food Outlets Relationship to Schools and Parks • Map schools • Map fast food outlets (“Retail”, “Eating Places”, “Fast Food, Pizza, Sandwiches”) • Draw 1000 ft. buffer around each school • Count and record fast food within buffer around each school • Repeat for parks • Repeat for both schools and parks using ½ mile buffer
1.Locate Neighborhood Census tracts: 06037224020 06037224010 06037226410 06037226000 2. Map schools 3. Map FF outlets 4.ID name of high school on Maple Ave and Washington Blvd. 5.Draw ½ mile buffer around this school 6.Find the number of FF outlets in buffer and in the neighborhood census tracts CX3 Tier 1NF9- Fast Food Outlets Exercise
Finalizing new GIS layer and method to include coffee shops, ice cream, donuts and other types of restaurants within ½ mile of schools • A “retail exposure scale” will be provided to help compare and identify schools • Also a neighborhood “school score” will be available to look at stores, fast food, outdoor marketing and mobile vending around schools
CX3Tier 1Mapping Practice in Local Area • Locate neighborhood in own county • Search by city • Turn on census tract layer and zoom in as needed • Select 1-4 census tracts using demographic criteria (income, race, other) • Map food stores using retail grocery layer • Open new internet window and locate public transit site (if available) • Find route(s) in neighborhood (try using transit score?) • Copy GIS map and legend to Word file and draw transit route (if no transit available, embellish map some other way.... ie. text box, etc)
http://www.cdph.ca.gov/programs/cpns/Pages/CX3_Main_Navgation.aspxhttp://www.cdph.ca.gov/programs/cpns/Pages/CX3_Main_Navgation.aspx
CX3Tier 1 Data Entry Send us your data and maps! Send completed worksheets to Lynn Fuhrman Lynn.Fuhrman@cdph.ca.gov 916-552-9862