Download
1 / 76
890 likes | 1.49k Views
This chapter provides a comprehensive introduction to Big Data Analytics, highlighting the vast opportunities and challenges across various industries. It discusses how organizations such as credit card companies and social networks utilize data to drive decisions, identify trends, and detect fraud. Key characteristics of Big Data, including volume, variety, and velocity, are examined, along with the different types of data structures. The text also outlines the emerging ecosystem surrounding Big Data, the evolving roles in analytics, and tools like Apache Hadoop that are revolutionizing data processing.

E N D
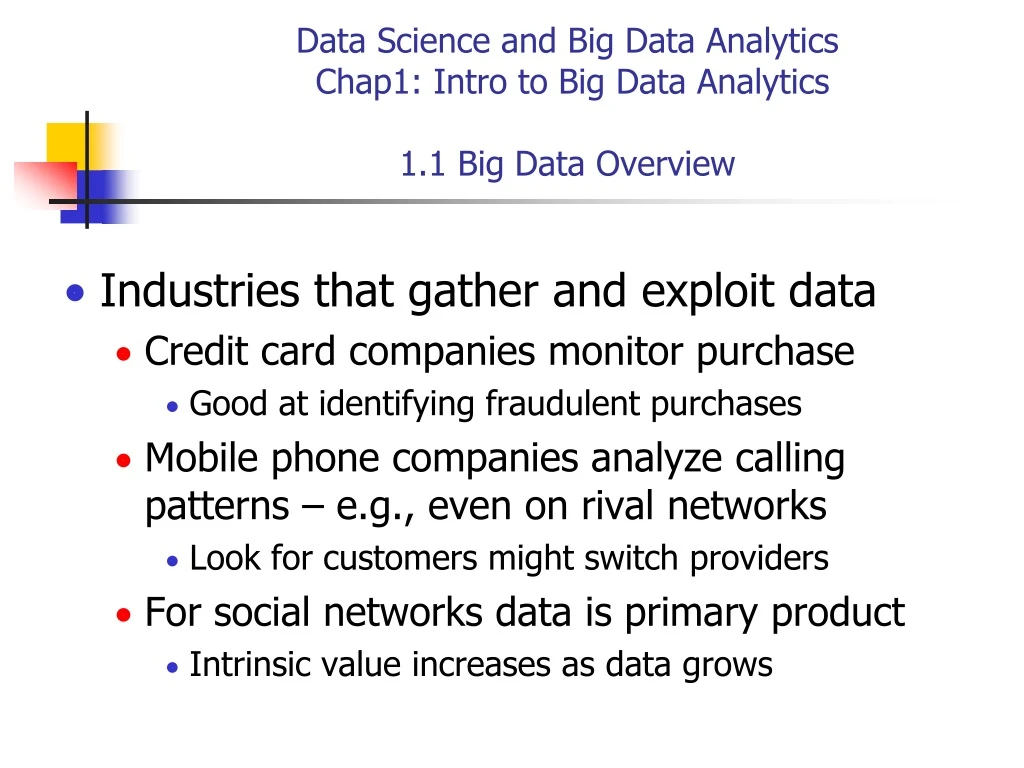
Data Science and Big Data Analytics Chap1: Intro to Big Data Analytics1.1 Big Data Overview • Industries that gather and exploit data • Credit card companies monitor purchase • Good at identifying fraudulent purchases • Mobile phone companies analyze calling patterns – e.g., even on rival networks • Look for customers might switch providers • For social networks data is primary product • Intrinsic value increases as data grows
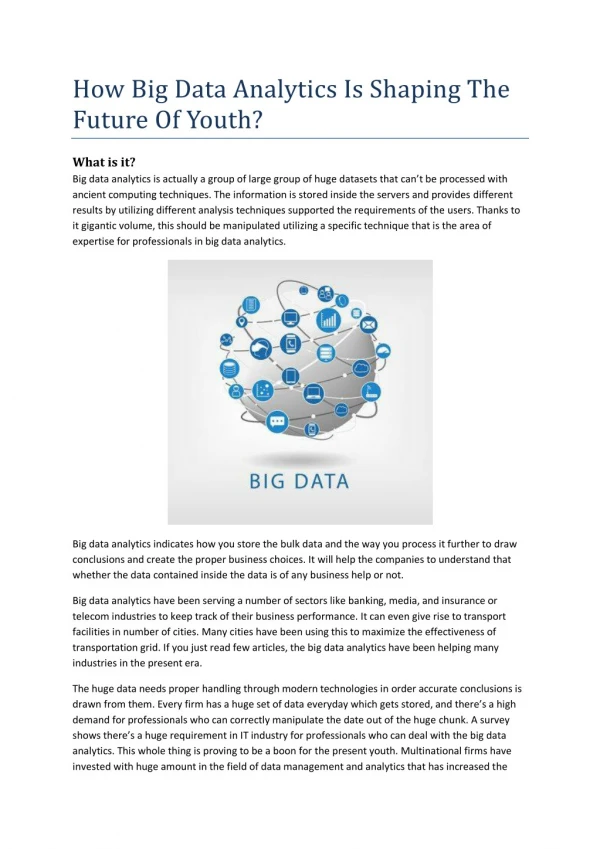
Attributes Defining Big Data Characteristics • Huge volume of data • Not just thousands/millions, but billions of items • Complexity of data types and structures • Varity of sources, formats, structures • Speed of new data creation and grow • High velocity, rapid ingestion, fast analysis
Sources of Big Data Deluge • Mobile sensors – GPS, accelerometer, etc. • Social media – 700 Facebook updates/sec in2012 • Video surveillance – street cameras, stores, etc. • Video rendering – processing video for display • Smart grids – gather and act on information • Geophysical exploration – oil, gas, etc. • Medical imaging – reveals internal body structures • Gene sequencing – more prevalent, less expensive, healthcare would like to predict personal illnesses
Data Structures:Characteristics of Big Data • Structured – defined data type, format, structure • Transactional data, OLAP cubes, RDBMS, CVS files, spreadsheets • Semi-structured • Text data with discernable patterns – e.g., XML data • Quasi-structured • Text data with erratic data formats – e.g., clickstream data • Unstructured • Data with no inherent structure – text docs, PDF’s, images, video
Example of Quasi-Structured Datavisiting 3 websites adds 3 URLs to user’s log files
Example of Unstructured DataVideo about Antarctica Expedition
1.2 State of the Practicein Analytics • Business Intelligence (BI) versus Data Science • Current Analytical Architecture • Drivers of Big Data • Emerging Big Data Ecosystem and a New Approach to Analytics
1.2.2 Current Analytical ArchitectureTypical Analytic Architecture
Current Analytical Architecture • Data sources must be well understood • EDW – Enterprise Data Warehouse • From the EDW data is read by applications • Data scientists get data for downstream analytics processing
1.2.3 Drivers of Big DataData Evolution & Rise of Big Data Sources
1.2.4 Emerging Big Data Ecosystem and a New Approach to Analytics • Four main groups of players • Data devices • Games, smartphones, computers, etc. • Data collectors • Phone and TV companies, Internet, Gov’t, etc. • Data aggregators – make sense of data • Websites, credit bureaus, media archives, etc. • Data users and buyers • Banks, law enforcement, marketers, employers, etc.
1.3 Key Roles for theNew Big Data Ecosystem • Deep analytical talent • Advanced training in quantitative disciplines – e.g., math, statistics, machine learning • Data savvy professionals • Savvy but less technical than group 1 • Technology and data enablers • Support people – e.g., DB admins, programmers, etc.
Three Recurring Data Scientist Activities • Reframe business challenges as analytics challenges • Design, implement, and deploy statistical models and data mining techniques on Big Data • Develop insights that lead to actionable recommendations
Profile of Data ScientistFive Main Sets of Skills • Quantitative skill – e.g., math, statistics • Technical aptitude – e.g., software engineering, programming • Skeptical mindset and critical thinking – ability to examine work critically • Curious and creative – passionate about data and finding creative solutions • Communicative and collaborative – can articulate ideas, can work with others
1.4 Examples of Big Data Analytics • Apache Hadoop • Open source Big Data infrastructure innovation • MapReduce paradigm, ideal for many projects • Social Media Company LinkedIn • Social network for working professionals • Can graph a user’s professional network • 250 million users in 2014
Summary • Big Data comes from myriad sources • Social media, sensors, IoT, video surveillance, and sources only recently considered • Companies are finding creative and novel ways to use Big Data • Exploiting Big Data opportunities requires • New data architectures • New machine learning algorithms, ways of working • People with new skill sets • Always Review Chapter Exercises
Data Analytics Lifecycle • Data science projects differ from BI projects • More exploratory in nature • Critical to have a project process • Participants should be thorough and rigorous • Break large projects into smaller pieces • Spend time to plan and scope the work • Documenting adds rigor and credibility
Data Analytics Lifecycle • Data Analytics Lifecycle Overview • Phase 1: Discovery • Phase 2: Data Preparation • Phase 3: Model Planning • Phase 4: Model Building • Phase 5: Communicate Results • Phase 6: Operationalize • Case Study: GINA
Data Analytics Lifecycle Overview • The data analytic lifecycle is designed for Big Data problems and data science projects • With six phases the project work can occur in several phases simultaneously • The cycle is iterative to portray a real project • Work can return to earlier phases as new information is uncovered
Key Roles for a Successful Analytics Project • Business User – understands the domain area • Project Sponsor – provides requirements • Project Manager – ensures meeting objectives • Business Intelligence Analyst – provides business domain expertise based on deep understanding of the data • Database Administrator (DBA) – creates DB environment • Data Engineer – provides technical skills, assists data management and extraction, supports analytic sandbox • Data Scientist – provides analytic techniques and modeling
Background and Overview of Data Analytics Lifecycle • Data Analytics Lifecycle defines the analytics process and best practices from discovery to project completion • The Lifecycle employs aspects of • Scientific method • Cross Industry Standard Process for Data Mining (CRISP-DM) • Process model for data mining • Davenport’s DELTA framework • Hubbard’s Applied Information Economics (AIE) approach • MAD Skills: New Analysis Practices for Big Data by Cohen et al.
Phase 1: Discovery • Learning the Business Domain • Resources • Framing the Problem • Identifying Key Stakeholders • Interviewing the Analytics Sponsor • Developing Initial Hypotheses • Identifying Potential Data Sources
Phase 2: Data Preparation • Includes steps to explore, preprocess, and condition data • Create robust environment – analytics sandbox • Data preparation tends to be the most labor-intensive step in the analytics lifecycle • Often at least 50% of the data science project’s time • The data preparation phase is generally the most iterative and the one that teams tend to underestimate most often
Preparing the Analytic Sandbox • Create the analytic sandbox (also called workspace) • Allows team to explore data without interfering with live production data • Sandbox collects all kinds of data (expansive approach) • The sandbox allows organizations to undertake ambitious projects beyond traditional data analysis and BI to perform advanced predictive analytics • Although the concept of an analytics sandbox is relatively new, this concept has become acceptable to data science teams and IT groups
Performing ETLT(Extract, Transform, Load, Transform) • In ETL users perform extract, transform, load • In the sandbox the process is often ELT – early load preserves the raw data which can be useful to examine • Example – in credit card fraud detection, outliers can represent high-risk transactions that might be inadvertently filtered out or transformed before being loaded into the database • Hadoop (Chapter 10) is often used here
Learning about the Data • Becoming familiar with the data is critical • This activity accomplishes several goals: • Determines the data available to the team early in the project • Highlights gaps – identifies data not currently available • Identifies data outside the organization that might be useful
Data Conditioning • Data conditioning includes cleaning data, normalizing datasets, and performing transformations • Often viewed as a preprocessing step prior to data analysis, it might be performed by data owner, IT department, DBA, etc. • Best to have data scientists involved • Data science teams prefer more data than too little
Data Conditioning • Additional questions and considerations • What are the data sources? Target fields? • How clean is the data? • How consistent are the contents and files? Missing or inconsistent values? • Assess the consistence of the data types – numeric, alphanumeric? • Review the contents to ensure the data makes sense • Look for evidence of systematic error
Survey and Visualize • Leverage data visualization tools to gain an overview of the data • Shneiderman’s mantra: • “Overview first, zoom and filter, then details-on-demand” • This enables the user to find areas of interest, zoom and filter to find more detailed information about a particular area, then find the detailed data in that area
Survey and VisualizeGuidelines and Considerations • Review data to ensure calculations are consistent • Does the data distribution stay consistent? • Assess the granularity of the data, the range of values, and the level of aggregation of the data • Does the data represent the population of interest? • Check time-related variables – daily, weekly, monthly? Is this good enough? • Is the data standardized/normalized? Scales consistent? • For geospatial datasets, are state/country abbreviations consistent
Common Tools for Data Preparation • Hadoop can perform parallel ingest and analysis • Alpine Miner provides a graphical user interface for creating analytic workflows • OpenRefine (formerly Google Refine) is a free, open source tool for working with messy data • Similar to OpenRefine, Data Wrangler is an interactive tool for data cleansing an transformation
Phase 3: Model Planning • Activities to consider • Assess the structure of the data – this dictates the tools and analytic techniques for the next phase • Ensure the analytic techniques enable the team to meet the business objectives and accept or reject the working hypotheses • Determine if the situation warrants a single model or a series of techniques as part of a larger analytic workflow • Research and understand how other analysts have approached this kind or similar kind of problem