Simulation of Daily Activities in Regional Centers Using MONARC Framework
270 likes | 391 Views
This paper discusses the MONARC simulation tool developed for simulating daily activities at regional centers. Utilizing Java technology, MONARC offers a flexible, distributed, process-oriented simulation environment. Key features include multi-threaded processing capabilities, advanced graphics support, and comprehensive data analysis tools. The simulation effectively models complex data patterns and job exchanges within large-scale distributed systems, providing valuable insights into resource management and computational efficiency. Contributions from researchers including Alexander Nazarenko and Krzysztof Sliwa are highlighted, emphasizing their work on simulation engines and data models.

Simulation of Daily Activities in Regional Centers Using MONARC Framework
E N D
Presentation Transcript
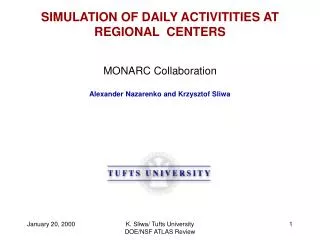
SIMULATION OF DAILY ACTIVITITIES AT REGIONAL CENTERS MONARC Collaboration Alexander Nazarenko and Krzysztof Sliwa K. Sliwa/ Tufts University DOE/NSF ATLAS Review
MONARC SIMULATION TOOLS • The simulation tool developed within MONARC is based on Java technology which provides adequate tools for developing a flexible and distributed process oriented simulation. Java has a built-in support for multi-threaded objects and for concurrent processing, which can be used for simulation purposes provided a dedicated scheduling mechanism is developed (this “simulation engine” has been developed by Iosif Legrand). • Java also offers good support for graphics which can be easily interfaced with the simulation code. Proper graphics tools, and ways to analyse data interactively, are essential in any simulation project (Alex Nazarenko’s contributions were the greatest here) • MONARC simulation and modelling of distributed computing systems provides a realistic description of complex data, and data access patterns and of very large number of jobs running on large scale distributed systems and exchanging very large amount of data (Data Model developed by Krzysztof Sliwa and Iosif Legrand) K. Sliwa/ Tufts University DOE/NSF ATLAS Review
Physics Group Analysis Physics Group Selection Reconstruction ESD Redefinition of AOD+TAG Replication (FTP) Monte-Carlo 200-400 jobs/day 20-40 jobs/day 2 times/year once/month after Reconstruction Baseline Model for Daily Activities Event processing rate: 1, 000, 000, 000 events/day K. Sliwa/ Tufts University DOE/NSF ATLAS Review
Regional Center Model K. Sliwa/ Tufts University DOE/NSF ATLAS Review
Raw Data DB Raw Data DB Raw Data DB VALIDATION MEASUREMENTS Multiple jobs reading concurrently objects from a data base. • Object Size = 10.8 MB Local DB access DB access via AMS server : “atlobj02” “atlobj02”-local “monarc01”-local client : “monarc01” 4 CPUs x 400MHz 2 CPUs x 300MHz DB on local disk DB on local disk DB on AMS Server 13.05 SI95/CPU 17.4 SI95/CPU monarc01 is a 4 CPUs SMP machine atlobj02 is a 2 CPUs SMP machine K. Sliwa/ Tufts University DOE/NSF ATLAS Review
Validation Measurements I The AMS Data Access Case Simulation Measurements 4 CPUs Client LAN Raw Data DB K. Sliwa/ Tufts University DOE/NSF ATLAS Review
Validation Measurements ISimulation Results Simulation results for AMS & Local Data Access 1,2,4,8,16,32 parallel jobs executed on 4 CPUs SMP system DB access via AMS Local DB access K. Sliwa/ Tufts University DOE/NSF ATLAS Review
Validation Measurements I The Distribution of the jobs processing time Simulation mean109.5 Measurement mean 114.3 Local DB access 32 jobs K. Sliwa/ Tufts University DOE/NSF ATLAS Review
Validation Measurements IMeasurements & Simulation Measurements Simulation K. Sliwa/ Tufts University DOE/NSF ATLAS Review
Validation Measurements II Server Client gsun sunlab1 Test 1 CNAF 1000BaseT Sun Ultra5, 333 MHz Sun Ultra5, 333 MHz vlsi06 cmssun4 Test 2 PADOVA 10BaseT Sun Ultra10, 333 MHz Sun Sparc20, 125 MHz monarc01 sunlab1 Test 3 CNAF-CERN 2 Mbps Sun Ultra15, 333 MHz Sun Enterprise 4X450 MHz K. Sliwa/ Tufts University DOE/NSF ATLAS Review
Measurements Simulation JobsM S Validation Measurements IITest 1 Gigabit Ethernet Client - Server K. Sliwa/ Tufts University DOE/NSF ATLAS Review
Validation Measurements IITest 2 Ethernet Client - Server K. Sliwa/ Tufts University DOE/NSF ATLAS Review
Validation Measurements IITest 3 2Mbps WAN Client - Server CPU usage 12 3 4 5 6 Data Traffic 12 3 4 5 6 K. Sliwa/ Tufts University DOE/NSF ATLAS Review
RAW ESD AOD TAG AOD TAG ESD AOD TAG Physics Analysis Example • Similar data processing jobs are performed in six RCs • CERN has RAW, ESD, AOD, TAG • CALTECH, INFN, Tufts, KEK has ESD, AOD, TAG • “Caltech2” has AOD, TAG K. Sliwa/ Tufts University DOE/NSF ATLAS Review
Physics Group Selection Number of Groups Follow AOD Jobs /group L Groups (L~10) M Groups (M~5) N Groups (N~5) p% of total TAG (~1%) q% of total TAG (~5%) r% of total TAG (~10%) 1-2 1-2 1-2 Each group reads 100% TAG events and follows: ~10% to AOD ~1% to ESD ~0.01% to RAW ~20 Jobs/Day in total evenly spread among participating RCs K. Sliwa/ Tufts University DOE/NSF ATLAS Review
2005-2006 Estimate of Parameters Parameter 2005 2006 Total CPU CPU Unit CPU I/O AMS I/O for Discs throughput for Tape Storage Disk Space Tape Space LAN 350,000 SI95 400 SI95/box (100 SI95/cpu) 40 MBps/box (0.1 MBps/SI95) 340 TB 1 PB 31 GBps 520,000 SI95 400 SI95/box (100 SI95/CPU) 40 MBps/box (0.1 MBps/SI95) 188 MBps/server 2000 MBps 540 TB 3 PB 46 GBps (Les Robertson's estimate of July 99) K. Sliwa/ Tufts University DOE/NSF ATLAS Review
Problem Setting: Analysis and Selection RAW ESD AOD TAG Database 1,000,000,000 CERN 1,000,000,000 Tier 1:Locally Tier2:@Tier1 1,000,000,000 Locally @ RC 1,000,000,000 Locally @ RC Physics Group Analysis 20 groups * 10 jobs 0.01% 1% Follow 100% of the group set Group set: 1% of total TAG Physics Group Selection 20 groups * 1job 0.01% 1% 10% 100% CPU (SI95) 250 25 2.5 .25 Totally220 Independent Jobs: 200 Physics Group Analysis and 20 Group Selection K. Sliwa/ Tufts University DOE/NSF ATLAS Review
Problem Setting: Reconstruction and FTP Size ESD AOD TAG FTP 1 DB/Job Tier 1 Centers Tier 1 & 2 Tier 1 & 2 Full Reconstruction 6,000,000 events/day yes yes yes Monthly Reconstruction 100,000,000 events/day no yes yes CPU (SI95) 250 25 2.5 K. Sliwa/ Tufts University DOE/NSF ATLAS Review
Participating Regional Centers RC Name Data WAN Connection CERN (Tier1) INFN (Tier1) KEK (Tier1) TUFTS (Tier1) CALTECH (Tier1) CALTECH-2 (Tier2) RAW, ESD, AOD, TAG ESD, AOD, TAG ESD, AOD, TAG ESD, AOD, TAG ESD, AOD, TAG AOD, TAG All RCs All Tier 1 All Tier 1 All Tier 1 All Tier 1 & Caltech-2 CERN (RAW) & CALTECH (ESD) 5 Tier 1 Regional Centers and one Tier 2 center 200 Analysis and 20 Selection Jobs are evenly spread among Tier1 RCs K. Sliwa/ Tufts University DOE/NSF ATLAS Review
AMS load distribution Participating RC Data Jobs CERN (Tier1) RAW, ESD, AOD, TAG 200 Physics Group Analysis 20 Physics Group Selection x40 One RC (CERN) configured to run 200 concurrent Physics Group Analysis Jobs and 20 Selection jobs a day Model1 (optimized AMS distribution) Model2 K. Sliwa/ Tufts University DOE/NSF ATLAS Review
1 RC Vs 5 RC: Group Selection on all data Participating RC Data Jobs CERN (Tier1) RAW, ESD, AOD, TAG 20 Physics Group Selection x10 Participating RC Data Jobs CERN INFN KEK TUFTS CALTECH RAW, ESD, AOD, TAG AOD, TAG AOD, TAG AOD, TAG AOD, TAG 4 Physics Group Analysis x10 4 Physics Group Analysis x10 4 Physics Group Analysis x10 4 Physics Group Analysis x10 4 Physics Group Analysis x10 Conclusion: Current configuration provides a possibility to redistribute resources without much increase in the cost; further optimization is needed to increase the efficiency: 1/(Time*Cost) Model1 One RC (CERN) minimally configured to run 20 concurrent Physics Group Selection Jobs a day Model2 Five Tier 1 Centers minimally configured to perform the same task K. Sliwa/ Tufts University DOE/NSF ATLAS Review
1 RC vs 6 RC: Reconstruction+Analysis+Selection Participating RC Data Jobs CERN (Tier1) RAW, ESD, AOD, TAG 20 Physics Group Selectionx10 200 Physics Group Analysis Full Reconstruction and FTP Participating RC Data Jobs CERN INFN KEK TUFTS CALTECH CALTECH-2 (Tier2) RAW, ESD, AOD, TAG ESD, AOD, TAG ESD, AOD, TAG ESD, AOD, TAG ESD, AOD, TAG AOD, TAG 4 Physics Group Selectionx10 40 Physics Group Analysis Full Reconstruction and FTP 4 Physics Group Selectionx10 40 Physics Group Analysis 4 Physics Group Selectionx10 40 Physics Group Analysis 4 Physics Group Selectionx10 40 Physics Group Analysis 4 Physics Group Selectionx10 40 Physics Group Analysis 20 Physics Group Analysis Conclusion: Current configuration provides a possibility to optimize the CPU power and reduce the cost; further optimization is possible to reduce WAN bandwidth to 30 MBps Model1 One RC (CERN) minimally configured to run all the Jobs a day Model2 Five Tier 1 Centers optimized to perform the same task with 30 MBps WAN K. Sliwa/ Tufts University DOE/NSF ATLAS Review
6 RC: Two types of Reconstruction+Analysis+Selection Participating RC Data Jobs CERN INFN KEK TUFTS CALTECH CALTECH-2 RAW, ESD, AOD, TAG ESD, AOD, TAG ESD, AOD, TAG ESD, AOD, TAG ESD, AOD, TAG AOD, TAG 4 Physics Group Selectionx10 40 Physics Group Analysis Full Reconstruction and FTP Monthly Reconstruction and FTP (10days) 4 Physics Group Selectionx10 40 Physics Group Analysis 4 Physics Group Selectionx10 40 Physics Group Analysis 4 Physics Group Selectionx10 40 Physics Group Analysis 4 Physics Group Selectionx10 40 Physics Group Analysis 20 Physics Group Analysis Conclusion: Current configuration provides a possibility to run daily the complete set of jobs at 6 centers with the WAN bandwidth 30 MBps and the network parameters not exceeding the estimate of 2005 Five Tier 1 and one Tier 2 Centers optimized to perform the complete set with 30 MBps WAN and optimized LAN Model1 (fixed values) Model2 (randomized data processing times and sizes) K. Sliwa/ Tufts University DOE/NSF ATLAS Review
Future Work: • Replication job: partial dataset replication from CERN to Regional Centers • Flexible data access: data exchange between Regional Centers without getting data directly from CERN (depending on load, availability,...) • Imposing coherence on the concurrent jobs: if Reconstruction and/or Replication is taking place, Analysis/Selection jobs should be able to monitor new data availability if requested • Improving Cost function: adding cost of WAN, adding other hidden costs currently not accounted for • Optimization with respect to the parameter Time*Cost for a given task run on different architectures K. Sliwa/ Tufts University DOE/NSF ATLAS Review