Spatial Distribution of Nitrogen Oxide in Taipei: Study & Analysis
10 likes | 108 Views
Investigating nitrogen oxide levels indoors and outdoors in Taipei to assess exposure risk among occupants. Study includes population sampling, data collection with passive samplers, and spatial analysis. Results show concentration variations in different locations. Future work involves further analysis of questionnaire data and statistical findings.

Spatial Distribution of Nitrogen Oxide in Taipei: Study & Analysis
E N D
Presentation Transcript
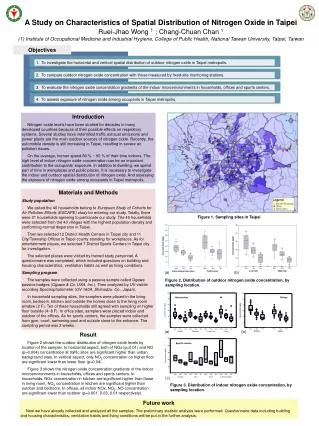
Objectives 1. To investigate the horizontal and vertical spatial distribution of outdoor nitrogen oxide in Taipei metropolis. 2. To compare outdoor nitrogen oxide concentration with those measured by fixed-site monitoring stations. 3. To evaluate the nitrogen oxide concentration gradients of the indoor microenvironments in households, offices and sports centers. 4. To assess exposure of nitrogen oxide among occupants in Taipei metropolis. A Study on Characteristics of Spatial Distribution of Nitrogen Oxide in TaipeiRuei-Jhao Wong 1;Chang-Chuan Chan 1(1) Institute of Occupational Medicine and Industrial Hygiene, College of Public Health, National Taiwan University, Taipei, Taiwan Introduction Nitrogen oxide levels have been studied for decades in many developed countries because of their possible effects on respiratory systems. Several studies have indentified traffic exhaust emissions and power plants are the main outdoor sources of nitrogen oxide. Recently, the automobile density is still increasing in Taipei, resulting in severe air pollution issues. On the average, human spend 80 % ~ 90 % of their time indoors. The high level of indoor nitrogen oxide concentration can be an important contribution to the occupants’ exposure. In addition to dwelling, we spend part of time in workplaces and public places. It is necessary to investigate the indoor and outdoor spatial distribution of nitrogen oxide. And assessing the exposure of nitrogen oxide among occupants in Taipei metropolis. Materials and Methods Study population We asked the 40 households belong to European Study of Cohorts for Air Pollution Effects (ESCAPE) study for entering our study. Totally, there were 21 households agreeing to participate our study. The 40 households were selected from the 40 villages with the highest population density and conforming normal dispersion in Taipei. Then we selected 12 District Health Centers in Taipei city and 11 City/Township Offices in Taipei county standing for workplaces. As for entertainment places, we selected 7 District Sports Centers in Taipei city for investigation. The selected places were visited by trained study personnel. A questionnaire was completed, which included questions on building and housing characteristics, ventilation habits as well as living conditions. Sampling program The samples were collected using a passive sample called Ogawa passive badges (Ogawa & Co. USA, Inc.). Then analyzed by UV-visible recording Spectrophotometer (UV-160A, Shimadzu. Co., Japan). In household sampling sites, the samplers were placed in the living room, bedroom, kitchen and outside the homes close to the living room window (2 F). Ten of these households still agreed with sampling on higher floor outside (4~8 F). In office sites, samplers were placed indoor and outdoor of the offices. As for sports centers, the samples were collected from gym, court, swimming pool and outside close to the entrance. The sampling period was 2 weeks. Figure 1. Sampling sites in Taipei Households Offices (a) (b) Sports centers (c) Figure 3. Distribution of indoor nitrogen oxide concentration, by sampling location. Result Figure 2 shows the outdoordistribution of nitrogen oxide levels by location of the sampler. In horizontal aspect, both of NOx (p=0.01) and NO (p=0.004) concentration at traffic sites are significant higher than unban background sites. In vertical aspect, only NO2 concentration on higher floor are significant lower than lower floor (p=0.04). Figure 3 shows the nitrogen oxideconcentration gradients of the indoor microenvironments in households, offices and sports centers. In households, NOx concentration in kitchen are significant higher than those in living room. NO2 concentration in kitchen are significant higher than outdoor and bedroom. In offices, all indoor NOx, NO2, NO concentration are significant lower than outdoor (p=0.001, 0.03, 0.01 respectively). (a) (b) Figure 2. Distribution of outdoor nitrogen oxide concentration, by sampling location. Future work Now we have already collected and analyzed all the samples. The preliminary statistic analysis were performed. Questionnaire data including building and housing characteristics, ventilation habits and living conditions will be put in the further analysis.


