Download
1 / 37
370 likes | 488 Views
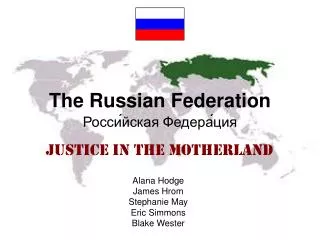
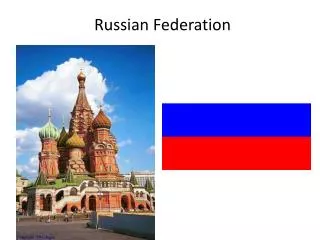
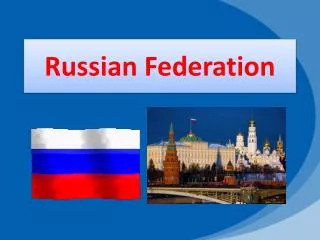
T h e Russian Federation. Citizens, Society and the State. By: Becky Thomas, Period 7. The Flag. Statistics. Population density in 2011: 8.4 / km 2 Capital city and its population in 2011: Moscow 11,621,000 Surface Area: 17,098,240 km 2 Population in 2011: 142,836,000

E N D
The Russian Federation Citizens, Society and the State By: Becky Thomas, Period 7
Statistics • Population density in 2011: 8.4 / km2 • Capital city and its population in 2011: Moscow 11,621,000 • Surface Area: 17,098,240 km2 • Population in 2011: 142,836,000 • Currency: Russian Ruble (RUB)
More Statistics • Urban vs. Rural • 73.2% Urban -102,701,802 • 26.8% Rural -37,664,759 • In the US, • 82.3% Urban - 261,375,057 • 17.7% Rural - 56,266,030
Russian Federation (83) Oblasts (46) Republics (21) Krais (9) Autonomous Okrugs (4) Federal Cities (2) Jewish Autonomous Oblast (1)
Major Cities Moscow – 11,621,000 Saint Petersburg – 5,028,000
Gender Disparity • 86.0 Males per 100 Females • Life expectancy at birth • Females – 75.0 Years • Males – 63.3 Years • Intentional homicides • Females 8.7 per 100,000 • Males 29.1 per 100,000 • US Comparison • 97.6 males per 100 females • Females - 81.3 years, Males - 76.2 years • Females 1.9 / 100,000, Males 6.6 per 100,000
Ethnicities Russians– 82.3% (Русские) Tatars– 4.3% (Татары) Ukrainians– 1.4% (Украинцы) Chuvash– 1% (Чуваши) Bashkirs- <1% (Башкиры) Armenians- <1% (Армяне) Avars- <1% (Аварцы) Mordvins- <1% (Мордвины) Germans- <1% (Немцы) Jews- <1% (Евреи) Kazakhs- <1% (Казахи) Belarusians- <1% (Белорусы)
Religion Orthodox Church (Belonging to) – 41% Believe without Religion – 25% Atheists – 13% Muslims (neither Sunni nor Shia) – 4.7% Other Christians – 4.1% Sunni Muslims – 1.7% Orthodox Church (Not Belonging to) – 1.5%
Concrete prayer: Russian Muslims celebrate Eidul-Fitr 30 August, 2011 06:08 PM | Photo by IlyaVarlamov
Muslims in Russia Estimated 2010 Population - 16,379,000 Percentage Muslim in Russia in 2010 -11.7% http://features.pewforum.org/muslim-population-graphic/#/Russia 21st largest Muslim Population by country 1% of World Muslim Population
Traditions, Superstitions, Jokes “If you wear clothes (such as an undershirt) inside out, you will get beaten. Your friend should point this out, wait for you to fix the clothes and then punch you symbolically.”
Wealth Gap US GINI coefficient is 41 Russia GINI coefficient is 40 UK GINI coefficient is 36 Fourth 20% - 21% Highest 10% - 32% Highest 20% - 47% Lowest 10% - 3% Lowest 20% - 6% Second 20% - 10% Third 20% - 15%
Income Distribution % Below the Poverty Line 40% as of 1999 25% as of 2002 12.7% as of 2011
Classes • Westernizer vs. Russian (“Slavophile”) • Soviet Attempts to abolish Class • No longer noble/peasant • Communist Party members vs. non-members • Nomenklatura • Communist Party has support • “the good old days”
Political Participation and Social Capital • 65.27% Voter Turnout in 2012 Presidential Election • USA Turnout in 2012 : 58.2% • Under Soviet Rule, 100% Voter Turnout • Not Fair Elections • Social Capital - Low • Apathetic, Futile, Knowledgeable • Strong Mistrust of Government
Civil Society • Political Parties • United Russia • Communist Party of the Russian Federation • Political Party LDPR • A Just Russia • ~1% Report Belonging to a Political Party • Interest Groups • State corporatist • Glasnost
Quiz Time! http://www.sporcle.com/games/psubball1/Russia http://www.sporcle.com/games/papageno/nations_border_Russia