Download
1 / 101
1.07k likes | 1.28k Views
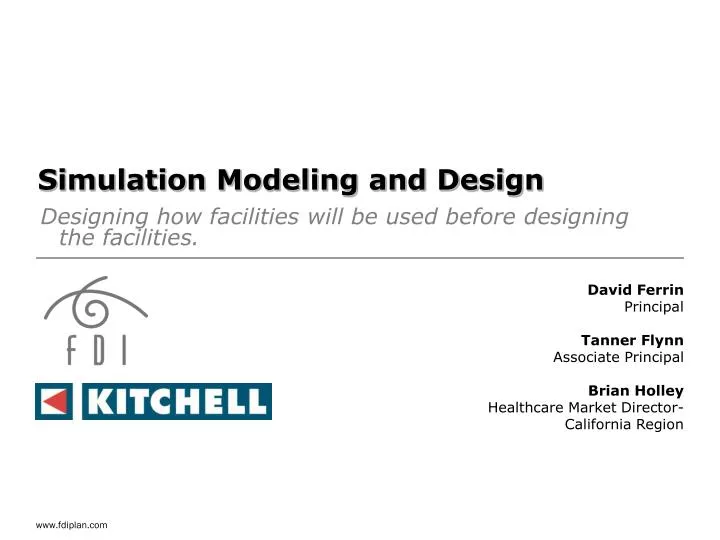
Simulation Modeling and Design. Designing how facilities will be used before designing the facilities. David Ferrin Principal Tanner Flynn Associate Principal Brian Holley Healthcare Market Director- California Region. Agenda. Lean Philosophy What is Simulation – Who uses it?

E N D
Simulation Modeling and Design Designing how facilities will be used before designing the facilities. David Ferrin Principal Tanner Flynn Associate Principal Brian Holley Healthcare Market Director- California Region
Agenda Lean Philosophy What is Simulation – Who uses it? Comparing Simulation To “Spreadsheet” Planning Simulation In Action - Methodology Case Study Outcomes and Conclusions
Lean Philosophy Lean means eliminating waste from any process or product. The first step is to identify the true Value Stream of a business process. A clearly defined and agreed upon Value Stream throughout the organization is the basis for any improvement action to achieve high process performance at a significantly reduced cost base.
Lean Philosophy • Conceptually, the business processes in Lean are viewed from the customer’s perspective. • The value of an activity is solely defined by the customer. • Activities that add value to the customer are those that make the product or service resemble more of what the customer actually wants and for which he is willing to pay. • Non value-added activities, however, do not create any value for the customer, and therefore all nonessential, non-value-added activities are considered as waste. • Waste is any activity in the workflow that adds time, effort or cost but does not create value.
Eliminate defects as defined by the customer Recognizes that variations hinder our ability to reliably deliver high quality products Requires data-driven decisions Set tools for effective problem solving Focus on maximizing process velocity Tools for analyzing process flows and delays Centers on value added vs non-value added Means for quantifying and eliminating complexity Six Sigma and Lean Six Sigma Lean
Lean and Six Sigma Lean = Improved process flow Six Sigma = Reduced process variation
Agenda Lean Philosophy What is Simulation – Who uses it? Comparing Simulation To “Spreadsheet” Planning Simulation In Action - Methodology Case Study Outcomes and Conclusions
How industry analysts regard simulation "Virtually all of the Fortune 50, a majority of the Fortune 1000 and military planning units of all technologically advanced countries, use simulation rather than subjective notions to make decisions about key manufacturing and logistics process decisions. There are no good reasons why simulation should not be used to aid decisions about key business processes. On the contrary, there are numerous good reasons why simulation should be used for BPR." Robert Crosslin "Simulation, The Key to Designing and Justifying Business Reengineering Projects" The Electronic College of Process Innovation . Simulation and animation technology offers ... organizations the potential to more rigorously test, analyze, validate and communicate their business processes and systems before they invest in implementation.” - The Gartner Group
Rush-Presbyterian-St. Luke’s Medical Center Organizations our team members have helped realize the benefits of Simulation Modeling
“When should we use simulation?” Simulation is the only tool that can provide the right answer when: • You can’t afford to miss the design the first time. • You need to evaluate complex system interactions - when operations have lots of steps with wide time variations and require multiple individuals and physical resources. • You need to understand the combined financial, operational, and human experience of the design
Agenda Lean Philosophy What is Simulation – Who uses it? Comparing Simulation To “Spreadsheet” Planning Simulation In Action - Methodology Case Study Outcomes and Conclusions
Run spreadsheet model: Most Planning Is Done Using Static Models Based on Averages • Example: • Let us attempt to model ED flow using averages (e.g. the spreadsheet model) • Patients arrive every 10 minutes • Each activity lasts 10 minutes • Can you predict what the mean patient LOS will be? • What will be the 95%-ile range?
The Results Are Predictable… And Do Not Mirror Real Processes! • Results of the spreadsheet model are at the right: • Notice the process behavior of the model: • Physicians finish their activity just as the next patient arrives • Patients never wait in queue • The LOS never varies • Patients move with drum-beat synchronicity through the ED • Physician utilization is effectively 100% Do real processes behave like this?
Triage is normally distributed with a mean of 10mins, and a standard deviation of 2mins Run simulation model: • Diagnosis is uniformly distributed, so that all times between 8 and 12 minutes are equally likely, mean is 10mins Simulation Accounts for Process Variability Let us introduce variability into this example (ED flow) and analyze the process: • Assessment is triangularly distributed, so that it always takes 8mins, usually takes 10mins, but never more than 12mins • Patient arrival is exponential with a mean of 10mins • Note-average times for these activities are still 10mins give or take a couple! Can you predict the new patient LOS? What will be the 95%-ile range?
Simulation Model Produces Drastically Different Outcomes From Spreadsheet Model • Results of the simulation model are at the right (50 iterations of 1 week are run): • Notice the process behavior of this model: • Patient LOS is 3 – 5 hours • Long queue waiting for Physician 1 • Physician utilization still 100% • Notice how small variations in the process increased patient LOS dramatically Only about 10% of the total LOS is value-added time; the rest is time spent in queue – how would you account for this on a spreadsheet?
Agenda Lean Philosophy What is Simulation – Who uses it? Comparing Simulation To “Spreadsheet” Planning Simulation In Action - Methodology Case Study Outcomes and Conclusions
Area of Opportunity Impact of Inpatient Discharge Time of Day on ED Length of Stay 13h 11m 11h 28m 10h 28m 10h 15m 10h 6m 9h 17m Inpatient Discharge Time of Day
Identifying a Facility “Break Point” How many visits to the Emergency Department can our facility handle as designed with 32 ED Beds and 370 IP Beds? ED LOS (hrs)
Animations Patient Care Throughput Operating Room ED 1 Patient Care Throughput 2 ED 2 Operating Room 2 Loading Dock ED 3 Clinics (3) Radiology Construction
Agenda Lean Philosophy What is Simulation – Who uses it? Comparing Simulation To “Spreadsheet” Planning Simulation In Action - Methodology Case Study Outcomes and Conclusions LAC+USC Medical Center UCSF Pharmacy Medical Center Operating Room California Department of Corrections and Rehabilitation
Case Study – LAC+USC Medical Center Simulations: Emergency Department Operating Suites House-wide Patient Throughput Outpatient Clinic Operations/Space Allocation Loading Dock
Case Study – LAC+USC Medical Center Project History Flagship Hospital of Los Angeles County Dept. of Health Services Originally 4 hospitals with 2,104 licensed beds 2 hospitals were destroyed in 1994 earthquake Complete replacement hospital approved designed for 946 beds - approved for construction of 600 beds
Case Study – LAC+USC Medical Center Facility Configuration Current Facility New Facility Inpatient Beds 671 600 Outpatient Visits 520,000 350,000 Admissions 38,000 - ED Visits 172,000 - Clinic Exam Rooms 340 217 Inpatient Length of Stay 6.1 days 5.5 days
97% 126% 143% 81% 73% 56% 34% 36% 29% 13h 11m 30h 27m 7h 30m Time to ED Bed ED LOS 95% ED LOS The Effects of a Volume Increase on the Emergency Department Design 3 Scenarios: Volumes increase by 5%, 10%, and 15% (95% IP Occupancy): 10% +5% 15%
Adding Observation Beds Allows Faster Discharge Patient Flow Process Times Associated With Addition of 22 Observation Beds: 125% 7h 15% 11h 13m 7h 30m 13h 11m 3h 6m 21h 57m 88% 20% 18h 39% 4.5h 38% 55% Wait Time For An IP Bed Time to ED Bed Time to ED Bed 95% ED LOS % Time ED General Bed Are Full
“Building a Duplicate ED” To Test ED Capacity Simulation Results if ED Had Twice the Number of Beds and Staff: 2X% 12h 44m 7h 30m 21h 57m 13h 11m 3h 6m 88% 28% 9h 28m 43% 9h 29m 81% 1h 24m 69% 27% Time to ED Bed Time to ED Bed 95% ED LOS % Time ED General Bed Are Full Wait Time For An IP Bed
Inpatient Bed Availability Is The Major Bottleneck In ED Operations 7h 30m 21h 57m 13h 11m 7% 20h 25m 10% 11h 52m 16% 6h 20m 28% 9h 30m 30% 15h 22m 46% 4h 52% 6h 20m 76% 5h 16m 83% 1h 16m +30 +10 +20 Time to ED Bed Time to ED Bed 95% ED LOS
Case Study – LAC+USC Medical Center Emergency Department Sized for 946 Inpatient Beds v. 600 – OPERATIONAL/DESIGN MISMATCH causing a dramatic impact on the ED More than 85% of inpatient admissions enter via the ED 3X the square footage with the same number of ED Beds 6 free-standing EDs moving into one location +172,000 visits - 3rd busiest ED in the US
Case Study – LAC+USC Medical Center Emergency Department - What did we learn? • Current demand v. new demand • Waiting Room Capacity Impact • Geographic Staffing • Impact of changes to Inpatient Occupancy Rate, LOS and DTOD • Effect of various changes to internal ED processes: radiology TAT Discharge process, etc.
Case Study – LAC+USC Medical Center Outpatient Clinic – Design Challenges • Excluded Primary Care (Internal Medicine Clinic) - Primary Care is on Campus today, with highest volume of all Clinic Groups • Designed to accommodate up to 350,000 Annual Visits - Must maintain current visits of over 500,000 annual visits. (42% increase) • Designed to accommodate Infusion Therapy Services for 22 patients in one location (Adult and Peds combined) - Current Infusion Therapy Services accommodates over 54 Infusion patients in one location (trending upwards) • Exam Rooms - 50% reduction Existing Buildings: 340 New Building: 171
Case Study – LAC+USC Medical Center Outpatient Clinic - Project Goals • Accommodate current service volumes • Minimize the move of services to the Community Health Centers • No addition of evening/off-hours sessions due to staffing limitations • Minimize session/schedule change to the extent possible • Minimize session over-time • Optimize space utilization of the new facility
Case Study – LAC+USC Medical Center Simulation gave us a way to… • Accommodate 500 individual Clinics in 104 Service Groups • Minimize clinic schedule changes to just 23 Services • Identify the 64 Services that needed to adjust their time per patient to sustain current volumes (benchmarked for feasibility) • Address numerous factors in the clinic operations to assess impact of clinic designation such as patient arrival patterns, appointment slots, physician ratios, etc. • Redesign, refine and standardized clinic processes • Experiment with over 120 scenarios to determine best fit for each clinic service
Case Study – LAC+USC Medical Center Without Simulation… • We would have had to try multiple scenarios using post-it notes and averages! • Move or eliminate services that we would have otherwise assumed would fit and function • Alternatives would have been tried in the facility at the expense of the patients
Case Study - Pharmacy Operations and Construction Phase Model Final Report
Situation Challenge • Pharmacy is transforming from centralized manual pick operation to a decentralized automated operation • Must stay operational with very limited space available for temporary setup. • Typical healthcare renovation challenges exist (ILS, ICRA, OSHPD, etc)
Narc Current BS Visual Representation of the pharmacy as it exists today. The departure point for the 4 phased construction project. IJS TI MP IV UD
New MP SL NARC All work stations are now in place Swiss Log & Carousals are installed for operation BS IJS IV UD
Objectives • Establish realistic expectations for the operational impacts and necessary planning during the design phase. • Communicate the phasing plan to the department users. • Define metrics for evaluating/ managing the plan. • Simulate results and define monitoring points
Approach • Phasing Overview • Design Team: BFHL Architects- San Francisco, C • Current versus New • Phases 1 – 4 • Metrics • Simulation Result- example of findings from data evaluation.
Narc UD Phase I BS MP IJS Unit Dose is moved to location in front of Narc. Manual Pick is moved to previous order entry location Transplant/Investigational & Order Entry is displaced elsewhere in the facility IV
NARC Phase 2 UD BS MP IVAS is moved to new home Inject able storage is moved to the previous transplant/Investigational IJS IV
NARC Phase 3 MP Bulk Storage is moved to new home Inject able storage is moved to new home Unit Dose is moved to new home BS IJS IV UD
Phase 4 MP NARC Narc is moved to new home Manual Pick is moved to new home BS IJS IV UD