Rayleigh-Plateau Instability
Rayleigh-Plateau Instability. Rachel and Jenna. Overview. Introduction to Problem Experiment and Data Theories 1. Model 2. Comparison to Data Conclusion More Ideas about the Problem. Introduction. The Rayleigh-Plateau Instability is apparent in nature all the time.


Rayleigh-Plateau Instability
E N D
Presentation Transcript
Rayleigh-Plateau Instability Rachel and Jenna
Overview • Introduction to Problem • Experiment and Data • Theories 1. Model 2. Comparison to Data • Conclusion • More Ideas about the Problem
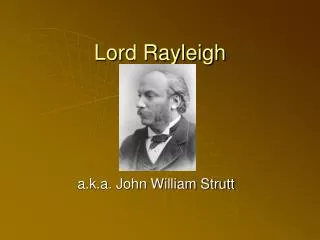
Introduction • The Rayleigh-Plateau Instability is apparent in nature all the time. • This instability occurs when a thin layer of liquid is applied to a surface and beads up into evenly spaced droplets of the same size. • Lord Rayleigh, a physicist of the 19th century, observed and modeled this particular instability. • He calculated that the most unstable wavelength (the wavelength that is seen) is about nine times the radius of the liquid.
Introduction • In this project we studied this instability that was discovered by Lord Rayleigh. • Many different aspects to model - Shape of Drops - Under what conditions does the instability occur - What is the expected wavelength between drops
Literature • There is a lot of literature on the Rayleigh-Plateau Instability and other related topics. • Lord Rayleigh wrote journals concerned with capillary tubes and the capillary phenomena of jets. • A book by Chandrasekhar modeled the conditions under which the instability will occur using the change in pressure (Laplace-Young Law) • Campana and Saita concluded that surfactants (a coating which cuts down on surface tension of a liquid) had no impact on the final shape, size or spacing of the drops in the instability. • Most articles considered a cylindrical jet which was vertical (not this model).
Procedure • 7 different liquids (motor oil, canola oil, syrup, corn syrup, dish soap, Windex and water) • 4 different types of string or wire • The string was attached horizontally with magnets to two upright poles. • The height of the string was checked by a ruler to maker sure it was level.
Procedure (cont.) • A centimeter length was marked on the string for a reference length in the pictures. • For consistency, Rachel took the pictures and Jenna placed the fluid on the string. • The motor oil, canola oil, dish soap, Windex, and water were put onto the string with an eye dropper, and the more viscous fluids, such as syrup and corn syrup were put onto the string with a popsicle stick. • This was chosen to ensure the most consistent initial cylinder on the string.
Procedure (cont.) • The data was measured in MATLAB. • The wavelength is the distance between each drop, which was measured from the top of one drop to the top of the next. • The diameter of the droplets was defined to be the distance from the top to the bottom of the largest part of the drop. • The radius of the drop is half of this distance.
Data • The data was collected from our experiments. • Only certain droplets with similar shapes and sizes in a row were measured. • The table shows the data for the red thread and the fishing string with several types of liquid. • Many other pictures were taken, but because of human error, only select data was used.
Data (cont.) • Red Thread
Data (cont.) • Fishing String
Theory (Shape of Drop) • We first want to model the shape of one of the drops on the string after the liquid has stabilized. • Assumptions • Perfect wetting of the string • Gravity does not affect the drops • Drop is axisymmetric (so we can find a model that describes the curve of the drop above the string)
Theory (cont.) • We let the string be oriented in the z-direction and have radius R0. • The equation for the drop that we want to model is r(z), and the drop width goes from 0 to L.
Theory (cont.) • We begin by looking at the energy of the drop. • When the liquid has stabilized the energy will be minimized, but the volume of the liquid will not change. • Minimize the energy, with a volume constraint. • Assuming no gravity, therefore the energy is proportional to the surface area.
Theory (cont.) • Where is the surface tension. • Use the Method of Lagrange multipliers to minimize the energy with the volume constraint.
Theory (cont.) • The function F for the Euler-Lagrange formula • We first use the Beltrami identity to find some relationships between our variables.
Theory (cont.) • Simplifying and combining the constants into a new constant C0 we get • Now using the perfect wetting assumptions, we have that when
Theory (cont.) • Therefore we get the relationship between . • Then our equation becomes
Theory (cont.) • Next we know that when r(z) is a maximum, r’(z) = 0. So we can find the value of rmax.
Theory (cont.) • Now we want to find the actual solution for r(z). • Use the Euler-Lagrange equation to do this.
Theory (cont.) • To begin to solve this second order nonlinear ODE, we rewrite it as a system of first order ODE. • Let w = r’, and therefore w’ = r’’.
Theory (cont.) • Therefore our system of first order ODEs is • The initial conditions are
Theory (cont.) • This system is not easily computed, so we need to solve it numerically. • We used the MATLAB function ode15s in order to do this. • Since is the surface tension constant, we varied in order to find the that meets the conditions
Theory (cont.) • Using the numeric values of R0=.01 cm and L=.14 cm, we find the value that satisfies these conditions is • These values of L and R0 are taken from the fishing string data (they are average values for that data).
Theory (cont.) • The numerical solution to our system is given by the following plot of points (z, r(z)).
Theory (cont.) • A least squares curve of best fit was fitted to these points. The equation of best fit was
Theory (cont.) • We also fit a cosine curve to the points, and found the curve of best fit. • The equation of this fit is r(z) = .034*cos(20(z-.07))
Analysis of Drop Shape • From the theory we have found a model that gives the equation for the shape of a drop. • We now want to compare our experimental data with the theory. • We compared our equation to motor oil and canola oil drops on the fishing string.
Drop 1 Drop 2 Analysis (cont.)
Analysis (cont.) • Drop 3
Analysis (cont.) • The average error between our model and actual data is .0094 cm. • Overall, the data seems to match our theoretical model for drops of the same string and similar drop width.
Analysis (cont.) • We also found the theoretical maximum value of the drop height (rmax). • The rmax value was the radius of the drop in our data. This is compared to the theoretical rmax value. • The average error is relatively small, only .0181 cm.
Theory (Instability) • We now want to find the perturbations to which the cylinder of liquid is unstable. • We will again take the z-axis to be through the thread, and r(z) to be the perturbed surface of the cylinder. • We let the perturbation be described by
Theory (cont.) • The wavelength, is given by . • We can compute the volume of the perturbed cylinder:
Theory (cont.) • Since we are looking a unit length and r(z) is periodic, the sine terms will go to zero. • The volume must be constant, so all epsilon terms must go to zero.
Theory (cont.) • Using this condition from the constant volume, we can calculate the surface area of the perturbed cylinder.
Theory (cont.) • Now using a binomial expansion we get an approximation for the surface area. • Again the sine terms cancel off and we get
Theory (cont.) • Now we want to use the Laplace-Young Law to find a condition for k. • We have where and
Theory (cont.) • Putting this back into the Laplace-Young Law we get • We know that they cylinder will be unstable when . This occurs when . Therefore the cylinder will be unstable when .
Analysis (cont.) • As seen in the last column, our data supports this theory. • The values of W-P are all positive except for the first one.
Analysis (cont.) • The expected wavelength from theory to will be seen in our experiment is defined as W0=2*Pi*sqrt(2)*R0. • This expected wavelength was compared to each of the measured wavelengths. • The error was very good on less viscous fluids, which spread onto the wire or string more evenly, such as canola or motor oil. However, error was much higher on syrup and corn syrup. This is most likely due to a human error when applying the liquid (due to ‘clumping up’). • Without the thicker substances, the average error for the wavelength was only .0464 cm.
Conclusion • Overall, the theory was verified by our experimental data. • Human error had a large impact on the validity of the theory (when applying the liquid it was difficult to obtain an even layer of liquid) • Numerical model is only valid for a particular string radius.