Download
1 / 35
350 likes | 441 Views
Ordination of marker-trait association profiles from long-term international wheat trials. Vivi Arief, Pieter Kroonenberg, Ian Delacy, Mark Dieters, Jose Crossa and Kaye Basford. Outline. Motivation Construction of the Wheat Phenome Atlas

E N D
Ordination of marker-trait association profiles from long-term international wheat trials Vivi Arief, Pieter Kroonenberg, Ian Delacy, Mark Dieters, Jose Crossa and Kaye Basford
Outline • Motivation • Construction of the Wheat Phenome Atlas • Three-way Principal Component Analysis of marker-trait association profiles
The Challenge • To develop a detailed understanding of the heritable variation in the wheat genome • To directly translate this knowledge into gains in wheat breeding
CIMMYT’s Wheat Program • Targets wheat breeding in 6 agro-ecological regions around the world • Contains a vast accumulation of knowledge, data and genetic resources • Is publicly available
Wheat Trials • 40 years of trials • With 10 or more international nurseries per year • And 50 to 400 entries per nursery • At 50 or more locations around the world → 17m phenotypic data points on >80 traits across 13k lines evaluated in >10k field trials (data worth >US$500m)
Pedigree • Pedigree information tracing the history of all 13k lines in the breeding programs
Seed Available • Retained seed in storage from all trials available for low-cost high throughput genotyping (can give 26m marker data points)
Unique resource • No other crop (to our knowledge) has this resource publicly available
Enabling Technologies • ASREML (in the last 10 years) • An analysis program that can deal with the 17m unbalanced data points • ICIS (in the last 5 years) • Database to capture the pedigree, phenotype and marker data • DArTs (since 2006) • The first of high through-put affordable marker systems • US$45 a DNA sample gives ~1,500 data points
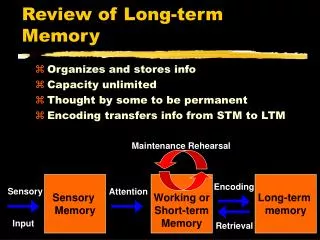
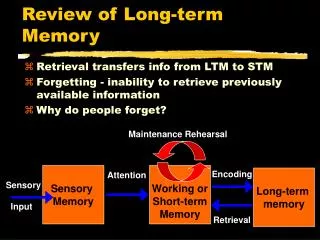
Phenome Map • Diagrammatic representation of the regions of a genome that influence heritable phenotypic variation for a trait
Phenome Atlas • The integration of all phenome maps and a description of the methodologies that were used to produce the maps
Producing theWheat Phenome Atlas • Focus on the ESWYTs Elite Spring Wheat Yield Trials
Phenotypic data Advanced lines with high yield potential • 25 cycles from 1979/80 to 2004/05 • 685 unique lines • 1445 trials across 400 locations • Phenotypic data for 20 traits • 8 agronomic traits (including grain yield) • 3 rusts (leaf, stripe and stem) • 9 other foliar diseases
The Analysis • Obtained BLUPs using ASREML • Fitted a separate residual and design for each trial • ESWYT 1 to 13: RCB • ESWYT 14 to 25: -lattice • Fitted separate models for combined association analysis and structured association analysis • Combined association analysis: G model • Family structure: G model • Spatial structure: GGL model • Temporal structure: GGY model
Genotypic data DArTs (Diversity Arrays Technology) • Dominant markers 1; 0; X • 1447 markers • ~1.4 million data points • 645 genotypes 599 unique genotypes (some are replicated)
The Analysis Association analyses • Simple t-test • for each trait • for each marker • for each structure Marker order • ESWYT disequilibrium map • No existing map shared more than 50% common markers with ESWYT • Obtained using ESWYT dataset
Wheat Phenome Atlas Version 1.0 • 10 Phenome maps: • Overall • Population structures Pedigree data Phenotypic data Marker data x 2 analytical methods • Environmental structures • Mega-environment • Phenotypic data • Combination of population and environmental structures • ESWYT cycle
A wheat phenome atlas • Phenome map: dense QTL map for a trait • Phenome atlas: collection and description of phenome maps
9 Other foliar diseases Stripe rust on the spike (YS) Septoria tritici blotch (ST) Septoria nodurum blotch (SN) Spot blotch (SB) Powdery mildew (PM) Barley yellow dwarf (BYD) Fusarium leaf blotch (FN) Tan spot (TS) Xanthomonas (XT) 8 Agronomic traits Grain Yield (GY) Kernel Size (KS) Plant Height (PH) Days to Heading (DH) Test Weight (TW) Grain Protein (GP) Lodging (LG) Shattering (SH) 3 Rusts Stem (SR) Leaf (LR) Stripe (YR) Increasing blue colour = increasing significance of positive association Increasing red colour = increasing significance of negative association
What did we find? • Many Trait Associated Markers (TAMs) for a trait • Multiple traits for a TAM • Association identified depend on: • what germplasm included • where tested • when examined
Phenome maps: markers traits For selection: genotypes markers traits Three-way principal component analysis
A TAM block • Markers in a linkage disequilibrium block showed significant association • log score 4
Association: positive Marker : present Association: negative Marker : absent
ME2 ME1
Summary Three-way ordination: • Summarizes genotype TAM block trait data • Reveals pattern in genotype TAM block trait data • Parental selection • Genotype screening • Prediction of selection outcome • Observed patterns depend on the genotype TAM block trait arrays used
Our Team Vivi Arief Ian DeLacy Hailemichael Desmae Christopher Lambrides Jacqueline Batley David Edwards Mark Dieters Ian Godwin Kaye Basford Jose Crossa Susanne Dreisigacker Tom Payne Ravi Singh Etienne Duveiller Guy Davenport Yann Manes Marilyn Warburton Graham McLaren Hans-Joachim Braun Jonathan Crouch Rodomiro Ortiz Peter Wenzel Eric Huttner Andrzej Kilian Also