Download
1 / 3
0 likes | 16 Views
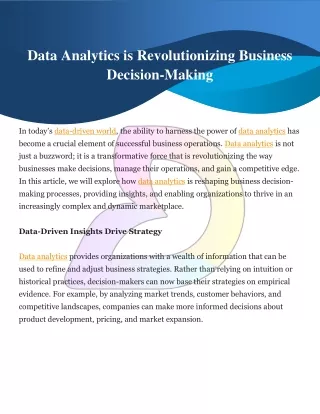
In today's data-driven world, businesses are inundated with complex information that can be overwhelming to interpret. Data visualization simplifies this process by transforming raw data into easy-to-understand visuals like charts, graphs, and dashboards. <br><br>The critical role of data visualization in modern business strategies emphasizes its ability to make complex data understandable, reveal hidden patterns, and improve decision-making. Businesses can quickly identify trends, monitor performance, and make informed decisions by presenting data clearly and compellingly.

E N D
The Power of Data Visualization in Modern Decision-Making | SR Analytics Have you ever looked at a detailed spreadsheet and felt completely lost? This is where data visualization can bring relief. Imagine transforming all the complex numbers and technical details into easy-to-understand pictures, like charts and graphs. This is exactly what data visualization does. It extracts the raw data and converts it into something you can easily interpret. Whether you visit a website, make an online purchase, or interact with brands, data constantly surrounds you. Here, we will explain the importance of data visualization for your business and how it can improve its overall performance. Importance of Data Visualization in Business Data visualization plays a significant role in creating a business strategy, whether transforming raw data into actionable insights or making understanding easier. This article will uncover the top three critical factors of data visualization in business. Making Complex Data Understandable Driving through data every day can be overwhelming due to boring structures. With data visualization, you can simplify and present the data in a more understandable format, such as graphs, charts, and dashboards. Such data highlights the key patterns and trends, making the data more straightforward for those without a technical background.
Identifying Patterns and Trends Data visualization has the potential to reveal hidden trends and patterns. For instance, a line chart can show the trend of sales over time, while a scatter plot can reveal the relationship between two variables. Visualizing data allows you to find insights that might have gone unnoticed in raw numbers. If you want to stay ahead of your businesses, recognize the ongoing trends and judge the market shift. Improving Data-Driven Decision-Making The ultimate goal of data visualization is to empower you to make informed decisions. When the data is presented in a clear, visual format, you can confidently make decisions for your business. This helps you make decisions based on facts rather than assumptions, bringing the desired result of your campaign. How Does Data Visualization Add Value to the Business? Data visualization helps businesses make better judgments and improve their operations. Learn how data visualization adds value to businesses in this era. Faster and More Effective Decision Making Data visualization influences decision-making by presenting complicated information in a more ready-to-understand format. Instead of aiming to understand complex spreadsheets or reports, you can quickly grasp the key insights presented through visual data. This helps businesses make quick decisions, leading to overall business success and providing a comprehensive advantage. Enhancing Storytelling with Data Another pro of data visualisation is that it transforms the raw data into a more compelling narrative. Visual data helps to explain complex stories into simpler data, which would be easier to grasp by non-technical audiences like investors, clients, and even executives. Business Use Cases of Data Visualization Below are mentioned some of the most popular cases of data visualisation in key businesses: Sales and Marketing Analytics Data visualization can help sales and marketing monitor campaign performance and understand customer behavior. For instance, a bar chart can show the performance of different marketing channels, while a funnel chart can represent the customer journey. Marketers also use dashboards to monitor key metrics like website traffic, conversion rates, and social media engagement.
Financial Analysis Financial analysis completely relies upon data visualization to track revenue, profit, and expenses. Economic performance can be traced using line graphs and bar charts, which helps quickly identify unusual fluctuations. For example, a business can use a pie chart to compare the revenue generated through different products. You can clearly understand through graphs which contribute more to your business. HR and Workforce Management Data visualization can also help HR and workforce management by analyzing employee productivity and turnover rates. The dashboard offers insights about employee performance, attendance, leave status, and work efficiency. Conclusion Data visualization reveals hidden patterns and inspires small businesses to estimate the market gaps. It helps you make data-driven judgments and grab opportunities. So, if you think data visualization is a luxury and unnecessary for businesses, you must think again. When raw data is transformed into a visually appealing format, it helps you make faster and smarter decisions without feeling overwhelmed. Businesses are adopting data visualization while brainstorming ideas. Now is your time to do the same. Choose data visualization to stay ahead of your competitors!