Download
1 / 4
40 likes | 129 Views
Explore randomness through coin flip experiments and pattern visualization. Use TI calculator programming for simulations. Discover the beauty of chaos in mathematical patterns.

E N D
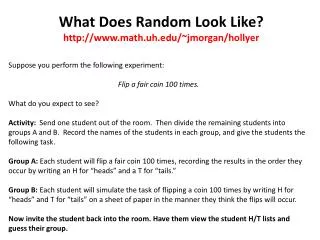
What Does Random Look Like?http://www.math.uh.edu/~jmorgan/hollyer Suppose you perform the following experiment: Flip a fair coin 100 times. What do you expect to see? Activity: Send one student out of the room. Then divide the remaining students into groups A and B. Record the names of the students in each group, and give the students the following task. Group A: Each student will flip a fair coin 100 times, recording the results in the order they occur by writing an H for “heads” and a T for “tails.” Group B: Each student will simulate the task of flipping a coin 100 times by writing H for “heads” and T for “tails” on a sheet of paper in the manner they think the flips will occur. Now invite the student back into the room. Have them view the student H/T lists and guess their group.
Exploring with TI Basic We can use the TI calculator to simulate 100 experiments of flipping a coin 100 times, where we keep track of the maximum streak length in each experiment. The program on the right uses J to keep track of the experiment. In each experiment, a list of length 100 containing random 0’s and 1’s is stored in L1. Then L2 is created to keep track of the streak lengths. Finally, the maximum value of the streaks for the experiment is recorded in L3(J). We display J at each step to keep track of the progress. For(J,1,100) randInt(0,1,100) → L1 1 → L2(1) For(K,2,100) If L1(K) = L1(K-1) Then L2(K-1)+1 → L2(K) Else 1 → L2(K) End End max(L2) → L3(J) Disp J End
What Does Random Look Like?(Part II) Create 3 points in the xy plane and label them A, B and C. Then pick a point P in the plane (at random) and plot it. Now pick a random integer from the set {1,2,3}. If the number selected is 1, then plot the midpoint between P and A. If the number selected is 2, then plot the midpoint between P and B. Otherwise, plot the midpoint between P and C. Whichever point you plot, call this new point P (removing the name from the old point P), and repeat the process MANY times (e.g. thousands of times). Question: Will any pattern appear, or will the resulting sketch look like a complete mess?
What Does Random Look Like?(Part II - continued) Amazing Answer: Regardless of the starting point, if you throw out the first 20 points, the remaining points will given a plot which looks like the one below. Note: This figure is called the Serpinski triangle.