Download
1 / 1
10 likes | 254 Views
We greatly appreciate the support from the for this project. Axial Compliance displacement wellbore head. Stage 3. Stage 2. Stage 1. Stage 4. 3.5. Stage 2. Stage 3. 3.0. 2.5. 2.0. Displacement ( μ m). Stage 4. 1.5. Stag 1. P s e. d. 1.0. Head vs Disp. 0.5. Drawdown. 0.0.

E N D
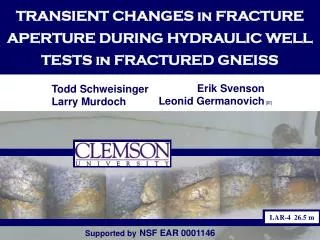
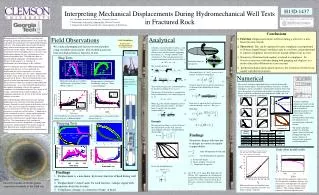
We greatly appreciate the support from the for this project • Axial Compliance • displacement • wellbore head Stage 3 Stage 2 Stage 1 Stage 4 3.5 Stage 2 Stage 3 3.0 2.5 2.0 Displacement (μm) Stage 4 1.5 Stag 1 P se d 1.0 Head vs Disp. 0.5 Drawdown 0.0 0 2 4 6 8 sc Head (m) Hydraulic head and axial wellbore displacements as function of time during a slug test Displacement as a function of head during a slug test. Slope = axial compliance Axial compliance as a function of time during slug tests at different depths. Packer Extensometer recovery Packer Axial compliance as a function of h/ho during slug tests. recovery pumping pumping H13D-1437 Interpreting Mechanical Displacements During Hydromechanical Well Tests in Fractured Rock • L.C. Murdoch (lmurdoc@clemson.edu) ,Clemson University • T. Schweisinger (tschwei@ces.clemson.edu), Clemson University • L Germanovich (leonid @ce.gatech.edu) , Georgia Institute of Technology • Conclusions • Field data: Displacement in the well bore during a well test is a non-linear function of head. • Theoretical: This can be explained because compliance is proportional to (fracture length/Young’s modulus) early in a well test, and proportional to asperity compliance (inverse fracture normal stiffness) late in a test. • Storativity of fractured rock aquifers is related to compliance. So, Storativity increases with time during both pumping and slug tests as a result of this effectStorativity is not constant. • Interpreting displacement signals increases the resolution of well tests in aquifer with discrete fractures. Analytical Field Observations Hydromechanical well tests involve measuring and interpreting mechanical displacements of an aquifer that accompany the transient pressure signal during hydraulic well tests. The displacement signal can be interpreted along with the transient pressure record to estimate characteristics of the aquifer. We have used a precision extensometer between straddle packers to measure axial displacements during slug tests and pumping tests in fractured crystalline rock. The field data show an apparent normal compliance of hydraulically active fractures in the range of 1 to 5 microns of displacement/(m of head change in the wellbore). However, during the more than 200 hydromechanical pumping and slug tests we have conducted, the displacement has always appeared as a hysteretic function of the well bore pressure; that is, displacements are smaller earlier in the test than they are at the same pressure late in the test. This hysteretic behavior is also typical of results from theoretical analyses using a discrete fracture model that considers coupled fluid flow and deformation. As a result, both field and theoretical data indicate that during well tests the apparent compliance of a formation can increase by a factor of 10 or more, and the theoretical analysis indicates the compliance approaches the inverse of the fracture normal stiffness at late times. This hydromechanical effect occurs because opening displacements are relatively small when the pressure change is limited to a small region of the fracture early in a test. This causes the apparent compliance to be less than it is later in the test when the pressure change has spread over a larger area of the fracture. Compliance is closely related to storativity, a basic aquifer parameter commonly assumed to be constant. These results indicate that storativity may actually change during a well test. One consequence is that variations in drawdown curves that are interpreted as resulting from variations in aquifer properties or transient changes in flow dimension may instead result from transient changes in storativity produced by this hydromechanical effect. We conducted pumping and slug tests between packers using a borehole extensometer. This resulted in pressure head and displacements as functions of time. Consider a circular fracture of radius, a, and aperture, d, internal fluid pressure, P. The effective stress on the asperities supporting the fracture is se. Youngs modulus of the wall rock is E. The total driving pressure causing displacement of the fracture walls is (1) The average aperture is (2) so (3) where the driving pressure is distributed over the fracture according to s = sw p1(r). The aperture of the fracture is assumed to be a linear function of se over small changes in se, so (4) Where Cn is the normal compliance, inverse of the normal fracture stiffness. It follows from (3) an d(4) that the aquifer compressibility is (5) Example Driving pressure during a well test will start out concentrated near the well, and will spread radially with time. The distribution will resemble So, for this distribution of s (6) Field Methods Slug Tests Idealized fracture in the analysis Following Doe et. al. (1982), storativity of a fracture is related to compliance (7) Using (5) and (6) we can get the storativity as a function of the distribution of driving pressure (8) From (6) it is apparent that t will increase with time during a well test. This gives Early time Late time Findings Storativity changes with time due to changes in controls on aquifer compressibility. Numerical Portable borehole extensometer deployed between packers for hydromechanical well testing The analysis considers radial fluid flow in a circular, deformable fracture of finite radius. The flow problem is treated in 1-D radial coordinates, and it is coupled to a solution from elasticity theory that gives the aperture of a circular crack loaded by an arbitrary pressure. Details of analysis in Murdoch and Germanovich (2006) (Int. Jour. Analyt. Numer. Methods in Geomech) Parameter estimation methods were used to fit the model to displacements and head or drawdown. Unknown parameters were E, Kn (normal stiffness), aperture, and heterogeneities representing crossing fractures or cemented zones within the fracture. The model (solid line) predicts the field data (points) quite well for both pumping and slug tests, giving estimates of fractured rock properties and heterogeneities. Displacement Pumping Tests Some other model results Type curve from pumping a deformable fracture (red line), line source solution (Theis) (heavy black), finite diameter well (dashed). a: fracture half-length E: Elastic modulus of wall rock Cn: Compliance of asperties Findings Doe, T.W., J.C.S. Long, H.K. Endo and C.R. Wilson. 1982. Approaches to evaluating the permeability and porosity of fractured rock masses. Proceedings of the 23rd U.S. Rock Mechanics Symposium, Berkeley, Calif.: pp. 31-37 1. Displacement is a non-linear, hysteretic function of head during well tests. 2. Displacement vs head varies for each fracture—unique signal with information about the fracture. 3. Compliance changes as a function of time, or head. Results from the numerical analysis show that the apparent compliance during a slug test increases and approaches the asperity compliance Cn (inverse fracture normal stiffness). This confirms findings from analytical solution in adjacent panel. Discrete fracture in biotite gneiss exposed in borehole at the field site. Difference between red and black lines occurs because apparent storativity of a fracture changes with time.