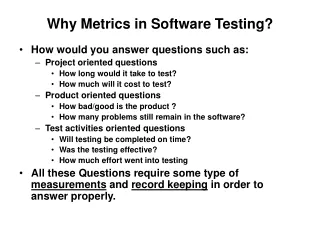
In-Process Metrics for Software Testing
Left – In materials testing, the goal always is to break it! That’s how you know how strong it is. In-Process Metrics for Software Testing. Kan Ch 10 Steve Chenoweth, RHIT. Of course, that method has limits!. Lots of testing metrics get proposed.

In-Process Metrics for Software Testing
E N D
Presentation Transcript
Left – In materials testing, the goal always is to break it! That’s how you know how strong it is. In-Process Metrics for Software Testing KanCh 10 Steve Chenoweth, RHIT
Lots of testing metrics get proposed • Question is – how much experience backs them up? • For each, also need to know: • Purpose • Data required • Interpretation • Use Right – It’s like the “Required” data on a form.
The test progress S curve Looks suspiciously close to plan, huh!
Of course… • Some test cases are more important than others. • Could assign scores to test cases. • Like 10 = most important, 1 = least. • Always subjective. • Test points should be planned. • What’s possible to test, when.
Tracking defect arrivals • Testing progress – usually built into tools. • Defect arrival pattern over time is important. • Defect density during testing – a summary indicator, but • Not an in-process indicator. • Pattern of defect arrivals over time – more informative. • Need to “normalize” what’s expected • And consider severity
Unfortunate severity pattern… More high severity at the end!
Defect backlog testing • Testing the “defects remaining.” • Use PTR backlog to judge. • Shows test progress. • Notes “customer rediscoveries.” • A large number of defects during development impedes test progress. • If you have a different organization for development testing vs fixing defects in the field, don’t ship with a significant backlog! Why?
When to focus on the backlog • During prime time for development testing, • The focus should be on test effectiveness and test execution. • Focusing too early on overall backlog conflicts with this. • Development team is reluctant to report defects! • Focus should be on fix turnaround of defects that impede test progress, vs on the entire backlog. • When testing approaches completion, • Then do strong focus on overall defect backlog.
Product size as an indicator • Lines of code = “Effort”? • Explains test progress • Helps measure total defect volume per unit. Feature removed – very interesting!
CPU Utilization? • There actually are many types of measurements you might want to do during a “stress test.” • CPU usage is certainly one of these. • Kan’s discussion is important – issues like “where the peaks occur, during a customer’s duty cycle” need to be investigated. • We’ll talk about this all later, under “performance metrics” (week 7)
System Crashes • Alias reboots, or IPLs (Initial Program Loads) • Alias “hangs” • This can also be starvation or deadlock, etc. • Related to CPU utilization • That leads to breaking things that can’t get done in their usual time(e.g., a lock release) • Also timing errors (more going on) • Associated resource problems (disks, memory) • High stress level
Other showstoppers • Takes only a few to render a product dysfunctional. • Qualitative “metric”: • Number of critical problems over time, with a release-to-release comparison. • Types of critical problems, and the analysis and resolution of each.
Kan’s recommendations • Use calendar time, instead of phases of the development process, as measurement unit for in-process metrics. • For time-based metrics, use ship date as the reference and weeks as the unit of measurement. • Metrics show “good” or “bad” in terms of quality or schedule. • Know which metrics are subject to strong management intervention. • Metrics should drive improvements.
Test coverage • Setup • Install • Min/max configuration • Concurrence • Error recovery • Cross-product interoperability • Cross-release compatibility • Usability • Double-byte character set (DBCS) Tends not to be tested enough! Leads to cascading problems!
Metrics for acceptance testing • Related to test cases • Percentage of test cases attempted • Number of defects per executed test case • Number of failing test cases without defect records • Related to test execution records • Success rate • Persistent failure rate • Defect injection rate • Code completeness Of course, sometimes “acceptance” means “by the customer”…
Good enough to ship? • System stability, reliability, and availability • Defect volume • Outstanding critical problems • Feedback from early customer programs • Other quality attributes of specific importance to a particular product and its acceptance
Recommendations for small organizations • Use: • Test progress S curve • Defect arrival density • Critical problems or showstoppers • Effort / outcome model to interpret metrics and manage quality • Conduct an evaluation on whether the product is good enough to ship