Download

1 / 22
230 likes | 359 Views
MARKAL Model for Macedonia. Macedonian Academy of Sciences and Arts (MANU). Skopje, March 1, 2011. Organization Chart for Strategic Planning Activity. Ministry of Economy. USAID. Planning Team Ministry Coordinators MANU. IRG/CRES Consultant Team. Planning Team.

E N D
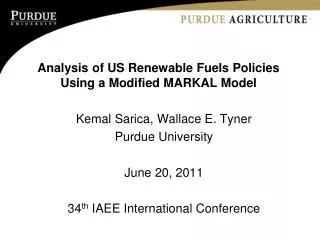
MARKAL Model for Macedonia Macedonian Academy of Sciences and Arts (MANU) Skopje, March 1, 2011
Organization Chart for Strategic Planning Activity Ministry of Economy USAID Planning Team Ministry Coordinators MANU IRG/CRES Consultant Team
Planning Team • Key organizations involved in model development • Ministry of Economy (MoE) • Research Center for Energy, Informatics and Materials - Macedonian Academy of Sciences and Arts (ICEIM - MANU) • Composition of the Planning Team Ministry Coordinators: Elena Kolevska Viktor Andonov (Core Group Member) Support Team: Acad Jordan Pop-Jordanov Acad Gligor Kanevce (Core Group Leader) Acad Tome Bosevski Prof. Anton Causevski Prof. Natasa Markovska Verica Taseska (Core Group Member) Nikola Bitrak (Core Group Member) 3
Key Aspects of MARKAL • Encompasses an entire energy system from resource extraction through to end-use demands as represented by a Reference Energy System (RES) network • Employs least-cost optimization • Identifies the most cost-effective pattern of resource use and technology deployment over time • Provides a framework for the evaluation of mid-to-long-term policies and programsthat can impact the evolution of the energy system • Quantifies the costs and technology choices that result from imposition of the policies and programs • Identifies the benefits arising for various policies and programs (e.g., increase energy security and economic competitiveness, reduced emissions) 5 5
What types of policy questions is it good at answering? • Impacts of technology development programs • Mandatory micro-measures in each sector: building code, building retrofit programs, modal-split incentives in freight and passenger transports, energy efficiency programs, etc. vehicle standards • Energy taxes, investment subsidies (e.g., green and white certificates, clean/efficient technologies) • Renewable portfolio or performance standards • Energy security evaluation (oil/gas/nuclear fuel imports energy options evaluation) • Emission targets and mechanisms (e.g., cap and trade, taxes, sector intensity) • Merits of education, information dissemination • Impact of social constraints, e.g. nuclear
Key Inputs • Current Energy Balance and characterization of the associated stock of existing technologies • Resource supply (step) curves, and cumulative resource limits • The characterization of future technology options • Fuels in/out, efficiency, availability, technical life duration • Investment, fixed and variable O&M costs, and “hurdle” rates • Emission rates • Limits on technical potential • Performance degradation (e.g., efficiency, maintenance costs) • Demand breakdown by end-use • Demand for useful energy • Own price (and income) elasticities {optional} • “Simplified” load curve • Discount rate, reserve margin 8
Key Indicators Total cost of the energy system Investment and operating costs for power plants and demand devices Expenditure on fuels Other annual expenditures Total primary energy Domestic production and imports by fuel Fuel consumption levels Electricity generation fuel mix Fuel choice and levels for each service demand Electricity timing and level (peak) by season/time-of-day Investments requirements for new supply and demand technologies Nature and timing of power plant builds, and refurbishment Device (and fuel) choice Energy (marginal) prices Fuel to each demand sector (with/without subsidies) Electricity by time-of-use Emission Sources and levels (Marginal) cost of carbon 9
Activities Undertaken • Development of Reference scenario, reflecting current knowledge of energy system evolution and probable future options (planning period 2006 - 2030) • Key areas of analysis • Renewable Target analysis, based on EC analysis of RE contribution, and in support of domestic RE Implementation Plan. • Energy Efficiency (EE) analysis, allowing for greater uptake of efficient technologies, implying appliance standards, for example. In addition, combined analysis with RE target. • Sensitivity analyses: postponed investment in electricity generation capacity, higher RE Targets, CO2 tax, CO2 cap 10
Reference (Business-as-usual) Scenario Assumptions • Calibrated to 2006 Energy Balance • National assumptions of economic growth and demographics, and their relationship to future demand for energy services • Generally aligned with Strategy for Energy Development of the Republic of Macedonia until 2030 • Base year energy prices from Macedonian sources, international energy price for projections from IEA-WEO 2009 • Firm power plant builds (and retirements) • Continued use of conventional fuels and technologies • Limited introduction of conservation or demand management measures • Known national policies (e.g. Feed-in Tariffs (FIT) for wind/solar)
Renewable Energy Analysis: Defining the Target & Goal Renewable Energy (RE) share in base year (2005) Based on national data sources, cross-checked with IEA and other public statistics US EIA data used to inform ‘normalised’ hydro levels Flat rate increase of 5.5% on base year RE share Figure based on EU 27 equally sharing half of their total ambition Additional requirement based on relative level of GDP per capita in 2005 Assumes additional effort per capita adjusted to account for relative GDP level Percentage increase calculated as additional effort divided by forecast final energy in 2020 Determine the optimal mix of power sector and demand shift to renewable sources, and what it displaces and costs 12
Energy Efficiency Potential Analysis Description Reference scenario assumption is that mainly conventional demand devices are chosenand limited conservation is the norm Use level of improved demand technology options for each demand service allowed them to reach up to 50% of the market share for new device purchases in 2030 Reflects policies to set appliance and building standards and limit the use of inefficient devices (e.g. prohibiting incandescent bulbs) Determine the economic optimal penetration level of the efficient and conservation options, and the resulting energy savings and costs 13
Impact on the Overall Cost of the Energy System (% change) • Renewable scenario is slightly more expensive (~0.42% or €62 million NPV (2006)) compared to the Reference Case, reflecting the high cost of the renewable technologies • Higher penetration of energy efficiency technologies can lead to significant reductions in system costs (-2.3%), due mainly to savings on fuel (-6.3%), even when RE Targets are imposed 14 14
Difference in Annual Energy System Costs • Annual costs (relative to Reference) increase under the RE target case once target implemented in 2021, rising up to €29 million by 2021 and stabilizing • Promoting Energy Efficiency can lead to significant annual savings in fuel supply of around 6.3% in 2030 without RE Target and 7.9% when there is an RE Target in place 15
Changes in Total Primary Energy • In all three scenarios - large reduction of imported gas • In the EE cases - important reduction in oil imports (transport sector not included) • In the RE cases - significant displacement of fossil fuels (as expected) totalling 1246 ktoe over the planning horizon 16
Electric Generation and Imports – (change from Ref.) • Under RE Target case: Increased generation from hydro plant (2021-27) and wind (in 2030); Reductions in coal and gas generation and electricity imports • Under EE and RE+EE case reductions in gas-fired generation and more hydro generation in RE+EE case 17
Decrease in Final Energy Consumption by Sector • Under the energy efficiency cases overall reduction in final energy consumption reaches 5% in 2030, mainly from electricity and oil • More efficient appliances for lighting, cooling and heating in buildings, and in iron & steel and non-metallic minerals industry (advanced technologies mainly using electricity and biomass). 18
Cumulative difference in CO2 Emissions • Under RE Target case fossil fuels generation (coal- and gas-fired) is displaced by hydro, resulting in cumulative CO2 emissions reduction of 1.5% • Under EE case lower demand of electricity reduces the gas-fired generation, leading to cumulative emissions reductions of around 3% • The combination of both, lower demand and displacing fossil fuel generation with renewables under RE+EE case, reduces the CO2 emissions by ~4 %. 19
Conclusions – RE Target • Renewable targets are achievable atmodest additional cost (result of significant investment levels in renewable generation as part of the current energy strategy) • The most cost-effective technologies are hydro and wind generation to the limits of their availability (incentives must be in place to ensure the required investment levels) • A higher RE target can achieve important co-benefits of enhancing energy security and lowering carbon emissions. 20
Conclusions – Promoting Energy Efficiency • Economic benefits could be significant due to availability of negative costoptions. • A wider economic assessment of the barriers to uptake and appropriate policy mechanisms should be undertaken. • Model results should be used as a starting point to identify the most economically attractive technologies. 21
Conclusions - Synergies RE and EE • Energy efficiency plays a key roll for achieving renewable target, energy security, and climate change mitigation goals • Both renewable and energy efficiency strategies have strong synergies with low carbon objectives • The analytic framework provides an important ability to assess a wide range of energy policy issues, and to advise the formulation of comprehensive strategies to guide the development of the Macedonian energy system 22