
Comparative Analysis of Xa13 Alleles in Rice: Genetic Variants and Functional Implications
This study presents a detailed sequence comparison of Xa13 resistance alleles from multiple rice lines, including IR24, Nipponbare, and others. It highlights nucleotide substitutions, deletions, and insertions relative to the IR24 reference sequence, emphasizing their potential impact on the Xa13 protein functionality. Black boxes represent coding regions while green and red triangles denote insertions and deletions, respectively. The analysis provides insights into the genetic variability among rice cultivars, showing how these variations may influence disease resistance mechanisms in rice.

Comparative Analysis of Xa13 Alleles in Rice: Genetic Variants and Functional Implications
E N D
Presentation Transcript
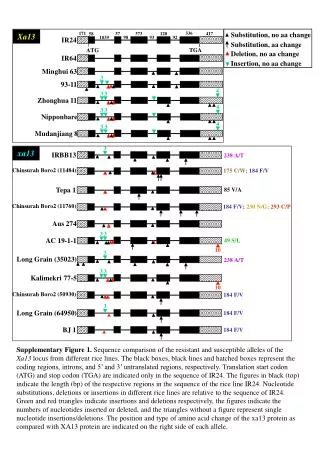
336 171 37 373 120 417 58 Xa13 1039 98 93 92 IR24 TGA ATG 3 IR64 93-11 4 3 3 Zhonghua 11 4 4 3 3 3 3 Minghui 63 Nipponbare Mudanjiang 8 xa13 3 IRBB13 238 A/T Chinsurah Boro2 (11484) 175 C/W; 184 F/V Substitution, no aa change Substitution, aa change Tepa 1 85 V/A Deletion, no aa change Insertion, no aa change Chinsurah Boro2 (11760) 184 F/V; 230 N/G;293 C/P Aus 274 3 3 AC 19-1-1 49 S/L 10 3 Long Grain (35023) 238 A/T 3 3 Kalimekri 77-5 10 Chinsurah Boro2 (50930) 184 F/V 3 Long Grain (64950) 184 F/V BJ 1 184 F/V SupplementaryFigure 1. Sequence comparison of the resistant and susceptible alleles of the Xa13 locus from different rice lines. The black boxes, black lines and hatched boxes represent the coding regions, introns, and 5’ and 3’ untranslated regions, respectively. Translation start codon (ATG) and stop codon (TGA) are indicated only in the sequence of IR24. The figures in black (top) indicate the length (bp) of the respective regions in the sequence of the rice line IR24. Nucleotide substitutions, deletions or insertions in different rice lines are relative to the sequence of IR24. Green and red triangles indicate insertions and deletions respectively, the figures indicate the numbers of nucleotides inserted or deleted, and the triangles without a figure represent single nucleotide insertions/deletions. The position and type of amino acid change of the xa13 protein as compared with XA13 protein are indicated on the right side of each allele.