Download
1 / 21
210 likes | 236 Views
Learn about the importance of Skills Assessments for strategic investment planning in Eilean Siar. Explore data on economic performance, workforce trends, education, and more. Understand the implications for skills investment planning in the region.

E N D
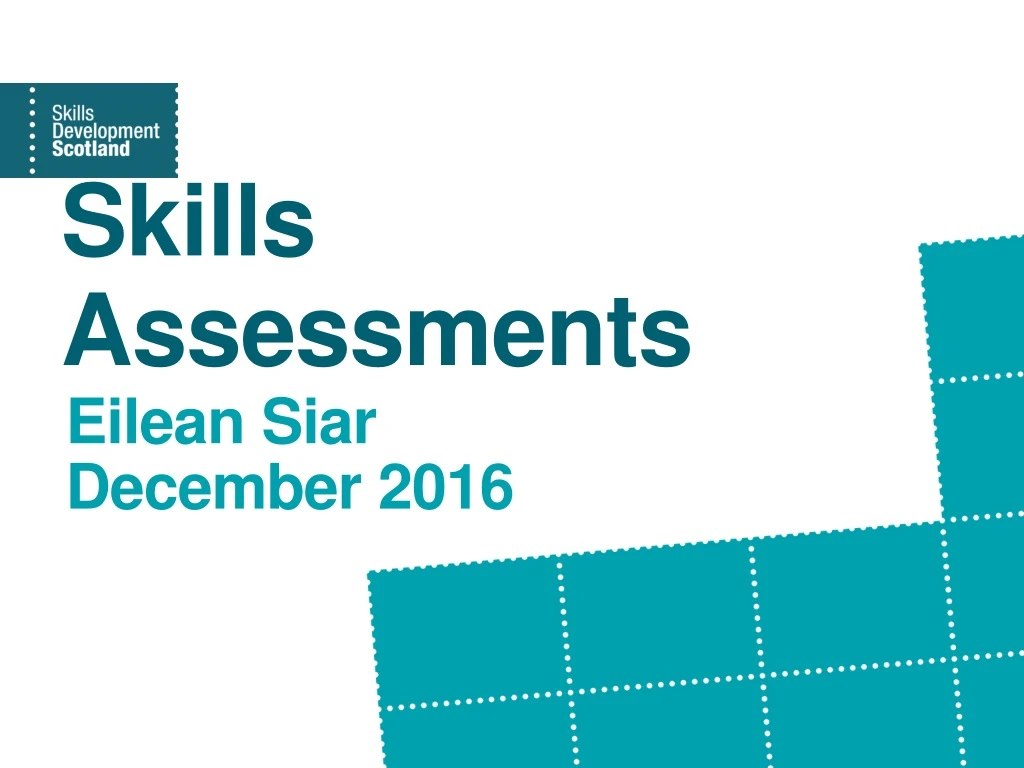
Skills Assessments Eilean Siar December 2016
Introduction • An Introduction to Skills Assessments • Key Data for Eilean Siar • Implications for Skills Investment Planning
What are Skills Assessments? • A single, agreed evidence base on which to base future investment in skills, built up from existing datasets • Partnership between Skills Development Scotland, Highlands and Islands Enterprise, Scottish Enterprise, the Scottish Funding Council (SFC) and the Scottish Local Authorities Economic Development Group. • Purpose: • Support SFC, Regional Colleges, Strategic Bodies and College Boards in negotiating Regional Outcome Agreements (ROAs) for Academic Years 2017-2020 • Provide a framework for aligning SDS investment in individuals and businesses • Assist partners in planning their strategic investment in skills • Highlight gaps in national and regional skills evidence
Why are they important for skills planning? • They provide a high quality and consistent source of evidence about economic and skills performance delivery at various spatial levels. • They can be used to identify strengths and any issues or mismatches arising, and so inform thinking about future planning and investment. • They are accessible online to support all partners in their planning. • They provide a core evidence base to support the Scottish Skills Planning Model.
What do they cover? • Economic Performance, Profile of the Workforce, People and Skills, Education and Training (Further and Higher Education, MAs and Schools), Other Economic Activity, Skills Mismatches and Forecasting • Underpinned by the 2016 data matrix of 7 workbooks, containing data on over 100 social and economic indicators • With data at various spatial levels: Regions; City Region Deal; Local Authority • The matrix only draws upon official datasets (including APS, BRES, UKCES, UK Business Counts, Census, Scot Gov datasets) and partner data (SFC, SDS, SE, HIE). • The data matrix is found here: https://www.skillsdevelopmentscotland.co.uk/what-we-do/partnerships/regional-skills-assessments/ • This slidepack provides a summary of the data for the area except for data on Further and Higher Education. The reason for this is provided on slide 15.
Local Authority Overview • Limited private sector activity • Low levels of productivity • More rural parts facing lack of employment opportunities • Dependence on primary activities and tourism
Business Trends • Much higher share of total employment is in Growth Sectors compared to Scotland (60% v 28%)
Workforce Trends Note: Data on total employment relates to 2014, having been prepared in advance of 2015 BRES release.
Schools Modern Apprenticeships Education and Training
Jobs and Skills Changes (1) Total employment (jobs) is forecast to decrease by 0.3% on average each year from 2016 to 2024, an equivalent rate of 0.2% growth is expected for Scotland as a whole. Such growth equates to a loss of 300 additional jobs in the region by 2024. Construction is the only sector expected to enjoy any growth, with an extra 100 jobs expected over the forecast. However such gains will be offset by falling employment within the public, education and wholesale and retail sectors. The number of jobs within public administration and defence is expected to fall by 200 over the forecast, whilst those in manufacturing and wholesale and retail will fall by 100 jobs each. Total Employment Growth Eilean Siar Employment % annual average change Change in total jobs (‘000s), 2016-2024 2002-2015 2016-2024 Note: chart uses total employment (jobs) rather than total employment (people). The former figure will be higher as a person can have more than one job. Source: ONS / Oxford Economics
Jobs and Skills Changes (2) Replacement demand will result in 2,500 openings within Eilean Siar over the forecast. Expansion demand is expected to contract by 300 openings between 2016-2024. Together with replacement demand, this will result in 2,200 openings over this period. Openings will be highest in elementary and professional occupations, driven replacement demand. The total requirement for workers in skilled trades is also expected to rise over the 2016-24 period, again driven by replacement demand. • Notes: • table uses total requirement (people) • totals may vary from previous slide due to rounding within the body of the table • Source: Oxford Economics