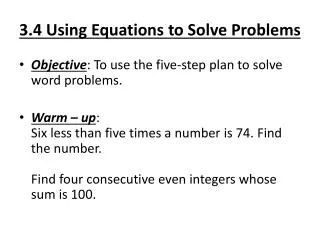
Solving Equations Using Graphs: Understanding Equation Solutions
Explore how to solve equations by finding intersection points on graphs. Learn the concept of equation solutions and apply it to various functions. Discover different methods, including graphing calculators, for solving equations graphically.

Solving Equations Using Graphs: Understanding Equation Solutions
E N D
Presentation Transcript
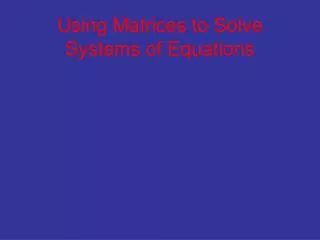
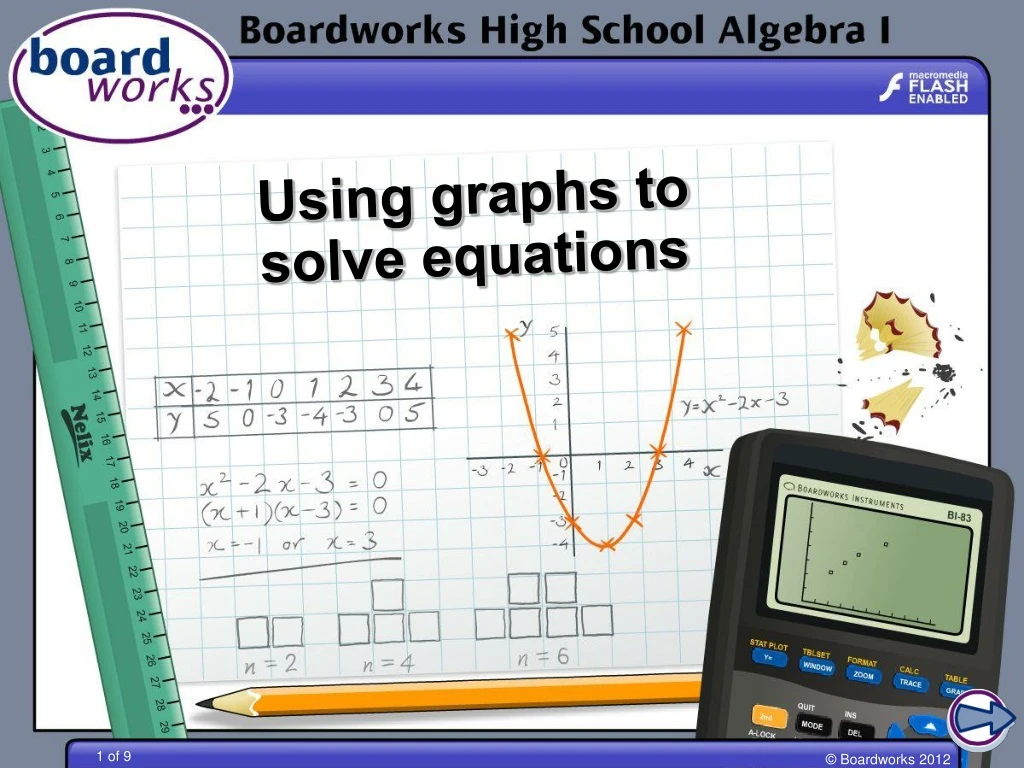
Solving equations What does it mean to solve an equation? Look at the equation x + 2 = 2x – 5. 10 8 Solving the equation means finding any values of x that make it true. 6 4 2 Think about the line y = x + 2. –6 –4 –2 0 2 4 6 8 10 There is a point on this line where x satisfies the equation. At that point, the y-value must also equal 2x – 5. –2 –4 –6 This means the point is also on the line y = 2x – 5. This point is where the lines y = x + 2 and y = 2x – 5 intersect.
Separate functions Solve the equation 2x2 – 5 = 3x using graphs. Treat the left side and the right side of the equation as two separate functions. 2x2 – 5 = 3x y = 2x2 – 5 y = 3x The points where the two graphs intersect give the solutions to the equation.
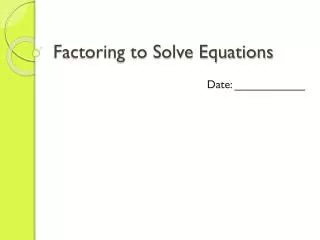
Points of intersection 10 8 6 4 2 –4 –3 –2 –1 0 1 2 3 4 –2 –4 –6 The graphs of y = 2x2 – 5 and y = 3xintersect at the points: y = 2x2 – 5 y = 3x (2.5, 7.5) (–1, –3) and (2.5, 7.5). The x-values at these coordinates are the solutions to the equation 2x2 – 5 = 3x: (–1,–3) x = –1 and x = 2.5
A single function We could also have solved the equation by rearranging so that all the terms are on the right-hand side. Solve the equation 2x2 – 5 = 3x using graphs. 2x2 – 3x–5 = 0 y = 2x2 – 3x–5 y = 0 The line y = 0 is the x-axis. This means that the solutions to the equation 2x2 – 3x– 5 = 0 are the roots of the graph y = 2x2 – 3x– 5.
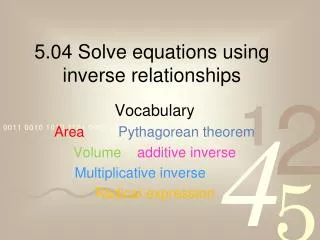
x-intersect 10 8 6 4 2 –4 –3 –2 –1 0 1 2 3 4 –2 –4 –6 The graphs of y = 2x2– 3x– 5 and y = 0intersect at the points: y = 2x2 – 3x – 5 (–1, 0) and (2.5, 0). The x-values of these coordinates are the solutions: (2.5, 0) (–1,0) y = 0 x = –1 and x = 2.5
Graphing calculators We can solve equations using graphing calculators. Solve the equation x2 – 3x + 1 = –2x + 5 using a graphing calculator. Press “Y=” and type in “Y1=X2–3X+1” and “Y2=-2X+5”. Press “GRAPH” to draw the graphs. Use “CALC”, the secondary function on the “TRACE” key, to find the points of intersection. Remember that we only need the x-coordinates. x = 2.56 and x = –1.56(to the nearest hundredth)