TTA Virginia
70 likes | 226 Views
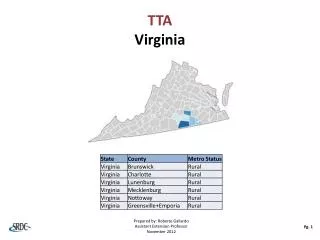
TTA Virginia. Prepared by: Roberto Gallardo Assistant Extension Professor November 2012. Pg. 1. TTA – Virginia. Pre-Defined* Clusters. *For a list of six-digit NAICS codes industries within each cluster see separate file Source: EMSI Complete employment – 2012.2.

TTA Virginia
E N D
Presentation Transcript
TTAVirginia Prepared by: Roberto Gallardo Assistant Extension Professor November 2012 Pg. 1
TTA – Virginia Pre-Defined* Clusters *For a list of six-digit NAICS codes industries within each cluster see separate file Source: EMSI Complete employment – 2012.2 Last Updated: October 2012 Pg. 2
TTA – Virginia (2002-2007) Transp. Equipment 2002-2007 % Change Jobs Mining Education Biomedical Transp. & Logistics Printing Energy Chemicals Agribusiness Forest Primary Metal Apparel 2007 LQ Pg. 3 Bubble size represents cluster’s average earnings in 2012 ; Source: EMSI Complete Employment – 2012.2
TTA – Virginia (2007-2012) Electrical Printing Business & Financial Machinery 2007-2012 % Change Jobs Primary Metal Biomedical Defense Education Energy Transp. &Logistics AER Mining Agribusiness Forest Chemicals Transp. Equipment 2012 LQ Pg. 4 Bubble size represents cluster’s average earnings in 2012; Source: EMSI Complete Employment – 2012.2
TTA –Virginia 2002-2007 Bubble Chart Results *Clusters were ranked in descending order based on their 2007 LQ Source: EMSI Complete Employment – 2012.2 Pg. 5
TTA –Virginia 2007-2012 Bubble Chart Results *Clusters were ranked in descending order based on their 2012 LQ Source: EMSI Complete Employment – 2012.2 Pg. 6
TTA –Virginia 2012 Expenditures & Leakage* *Only top 20 industries used to calculate the leakage Sorted in descending order based on total expenditures Source: EMSI Complete Employment – 2011.4 Pg. 7
![TTA Studio Project [MOSP]](https://cdn4.slideserve.com/631823/slide1-dt.jpg)