Download

1 / 12
120 likes | 213 Views
Learn how to calculate confidence intervals and conduct hypothesis tests on proportions with statistical assumptions and practical examples.

E N D
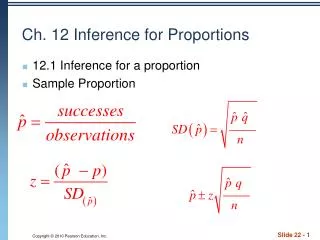
Assumptions: • SRS • Normal distribution np > 10 & n(1-p) > 10 • Population is at least 10n
Normal curve Formula for Confidence interval: Note: For confidence intervals, we DO NOT know p – so we MUST substitute p-hat for pin both the SD & when checking assumptions.
A May 2000 Gallup Poll found that 38% of a random sample of 1012 adults said that they believe in ghosts. Find a 95% confidence interval for the true proportion of adults who believe in ghost.
Assumptions: • Have an SRS of adults • np =1012(.38) = 384.56 & n(1-p) = 1012(.62) = 627.44 Since both are greater than 10, the distribution can be approximated by a normal curve • Population of adults is at least 10,120. Step 1: check assumptions! Step 2: make calculations Step 3: conclusion in context Using methods such as these, the interval between 35% and 41% captures the true proportion of adults who believe in ghosts 95% of the time.
To find sample size: However, since we have not yet taken a sample, we do not know a p-hat (or p) to use! Another Gallop Poll is taken in order to measure the proportion of adults who approve of attempts to clone humans. What sample size is necessary to be within + 0.04 of the true proportion of adults who approve of attempts to clone humans with a 95% Confidence Interval?
What p-hat (p) do you use when trying to find the sample size for a given margin of error? .1(.9) = .09 .2(.8) = .16 .3(.7) = .21 .4(.6) = .24 .5(.5) = .25 By using .5 for p-hat, we are using the worst-case scenario and using the largest SD in our calculations.
Another Gallop Poll is taken in order to measure the proportion of adults who approve of attempts to clone humans. What sample size is necessary to be within + 0.04 of the true proportion of adults who approve of attempts to clone humans with a 95% Confidence Interval? Use p-hat = .5 Divide by 1.96 Square both sides Round up on sample size
Hypotheses for proportions: H0: p = value Ha: p > value where p is the true proportion of context Use >, <, or ≠
A company is willing to renew its advertising contract with a local radio station only if the station can prove that more than 20% of the residents of the city have heard the ad and recognize the company’s product. The radio station conducts a random sample of 400 people and finds that 90 have heard the ad and recognize the product. Is this sufficient evidence for the company to renew its contract?
Assumptions: • Have an SRS of people • np = 400(.2) = 80 & n(1-p) = 400(.8) = 320 - Since both are greater than 10, this distribution is approximately normal. • Population of people is at least 4000. Use the parameter in the null hypothesis to check assumptions! H0: p = .2 where p is the true proportion of people who Ha: p > .2 heard the ad Use the parameter in the null hypothesis to calculate standard deviation! Since the p-value >a, I fail to reject the null hypothesis. There is not sufficient evidence to suggest that the true proportion of people who heard the ad is greater than .2.