Download
1 / 17
170 likes | 199 Views
Learn how to make inferences about proportions, comparing proportions from two populations or treatments. Explore the basics, assumptions, examples, and hypothesis testing.

E N D
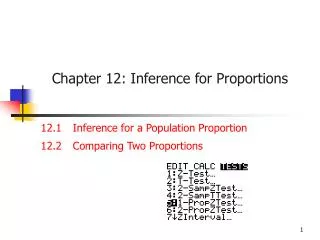
Proportions • Our earlier analysis focused on inference about population means. • Now we turn our attention to inference about the proportion of some outcome in a population. • We will consider a single population and then compare proportions from two populations or treatments.
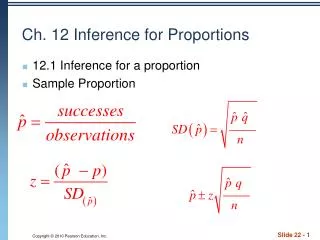
The Basics • Population Proportion: • Sample Proportion: • is a point estimate of P
Sampling Distribution of Sample Proportion • Choose an SRS of size n from a population that contains proportion p of ‘characteristic’. Let the sample proportion be defined as the number in the sample with the ‘characteristic’ divided by n. • As the sample size increases, the sampling distribution of the sample proportion becomes approximately normal. • The mean of the sampling distribution is p, the population proportion. • The standard deviation of the sampling distribution is
Assumptions for Inference about a Proportion • The data are an SRS from the population of interest. • The population is at least ’10’ times as large as the sample. • Fact: The normal approximation to the distribution of the sample proportion is most accurate when p = 0.5
Comparing Two Proportions • Setting 1: Independent Samples from two populations • proportion of items in population 1 with characteristic • proportion of items in population 2 with characteristic • Setting 2: Randomly assign subjects to one of two treatments • Probability of success with treatment 1 • Probability of success with treatment 2 • In both settings, we wish to compare .
Hypothesis Test for • Ho: • Under Ho, estimate the same quantity.