Difference in Differences (Panel Data)
Difference in Differences (Panel Data). Sebastian Galiani November 2006. Police & Crime. Police & Crime. Difference in Differences. Suppose that the process that determines crime is: . Where t = 0 + t and u it = i + it for t = 0, 1. E( it ) = 0 for all i and t.


Difference in Differences (Panel Data)
E N D
Presentation Transcript
Difference in Differences (Panel Data) Sebastian Galiani November 2006
Difference in Differences • Suppose that the process that determines crime is: • Where t = 0 + t and uit = i + it for t = 0, 1. E(it ) = 0 for all i and t. • And where:
Difference in Differences • The change in crime for treated units is: • While its mean is: • We now assume that:
Difference in Differences • Which also implies: • Note that this average before-after comparison is not an unbiased estimate of TOT
Difference in Differences • The change in crime for untreated units is: • While its mean is: • Then, the difference of the differences (1) – (2) is a consistent estimator of 1.
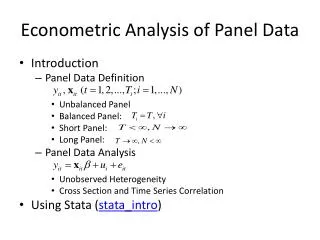
Outcome Average Treatment Effect on the Treated Treatment Group Control Group Time Treatment
Outcome Average Treatment Effect on the Treated Estimated Average Treatment Effect on the Treated Treatment Group Control Group Time Treatment
Example Do Police Reduce Crime?Estimates using the Allocation of Police Forces after a Terrorist Attack R. Di Tella and E. Schargrodsky AER (2005)
Events & Data • The authors of this paper obtained all the information available to the police (with the exception of the victim’s name) about each auto theft in these neighborhoods for the nine-month period starting April 1, 1994 and ending December 31, 1994. Figure 1: Timeline of Events
Policy Discussion • How much crime is reduced if we hire an extra policeman? The results of this paper suggest that the effect is large, but extremely local. Police presence reduces car thefts in the block, and no effect just one block away is found. • During this period, a Buenos Aires policeman was earning on average a monthly wage of $800. Given that policemen work eight-hour shifts and average 21 work days per month, the monthly cost of providing police protection for one block is approximately $3,428. • The estimates of this paper suggests that police presence in a block would induce a reduction of 0.081 of a car theft per month. The average value of the stolen cars in this sample is $8,403. Thus, in terms of the reduction in auto-theft exclusively, the protection policy was not cost-effective.
Policy Discussion • Of course, the deployment of visible police protection could also deter other types of crime, and benefit citizens in terms of increased feelings of security. Importantly, incapacitating criminals is likely to substantially benefit society, whereas the estimates of this paper capture only deterrence effects. • On the other hand, part of the car theft reduced in the protected blocks could just be displaced to other areas (or to other criminal activities).
Conclusions • The estimates of this paper suggest that there is a large, negative, but very local effect of observable police presence on car theft. The magnitude of the same-block effect is important in economic terms (75%). This effect is due to deterrence (not incapacitation). • The paper finds no effect of observable police presence on car theft in the immediate surrounding area (one, two, or more blocks away). • However, these results are pessimistic on the social returns of this police technology: the deployment of uniformed police officers in fixed locations
Example Water for Life: The Impact of the Privatization of Water Services on Child Mortality Sebastián Galiani, Universidad de San AndrésPaul Gertler, UC Berkeley Ernesto Schargrodsky, Universidad Torcuato Di Tella
Use Discrete Time Hazard to estimate determinants of privatization…Find • Political party controlling municipal government • Federal, Peronist and Provincial more likely to privatize • Radical less likely to privatize • Does not depend on • Lagged changes in income, unemployment, inequality • Lagged changes in mortality rates
World Bank Survey 2000 shows access expanded most among poor 1993-2000
Actual D in D Implementation • Difference in Difference in regression form • Assumes in controls is good estimate of counterfactual • what would have happened to treatments if no intervention • Test using only pre-intervention years that time trend in controls is same as time trend in treatments • Cannot reject the hypothesis of same trends between treatments and controls.
Dif-in-Dif Estimates: Privatization Significantly Reduced Child Mortality
Impact of Privatization Greatest in Poor and Extremely Poor Municipalities
Conclusions: Using a combination of methodsfind that … • Privatization of water services is associated with a reduction in child mortality of 5 to 7 percent • The reduction in mortality is from • a drop in deaths caused by infectious/parasitic diseases, • not from causes unrelated to water • Most of the reduction in mortality occurred in low-income areas
Contrary to the concerns about negativehealth effects & worsening inequality Our evidence suggests that… • The deterioration in Argentine water systems under public management was so large that privatization • generated profits, attracted investments, expanded service, and • reduced child mortality. • While private sector may provide sub-optimal services, it does a better job and the poor are benefiting from it
Effect on Mortality by Income Group • Find higher impact in poor municipalities • Most of increase in access was in lower income groups • High-income groups already had a high rate of connection to the water network prior to privatization. • Even when service quality was unsatisfactory, high income sectors enjoyed better access to substitutes • e.g. pumped wells, septic tanks, or bottled water • Again rules out many other explanations of results
Example The Central Role of Noise in Evaluating Interventions that use Test Scores to Rank Schools Chay et al. (2005) AER
Progressing through PROGRESA • One of the greatest tragedies of extreme poverty is its intergenerational transmission. • One way to break the intergenerational transmission is to invest in the human capital of children living in poverty. • PROGRESA, an anti-poverty program developed in Mexico, combines a traditional cash transfer program with financial incentives for families to invest in the human capital of their children.
PROGRESA • In 1997, the federal government of Mexico introduced PROGRESA: Education, Health, and Nutrition Program. • The program is primarily aimed at improving the educational, health and nutritional status of poor families. • PROGRESA provides cash transfers linked to children’s enrollment and regular school attendance and to clinic attendance. • The program also includes in-kind health benefits and nutritional supplements for children up to age five, and pregnant and lactating women.
Unlike earlier social programs, PROGRESA intervenes simultaneously in health, education and nutrition. • The integrated nature of the program reflects a belief that addressing all dimensions of human capital simultaneously has greater social returns than their implementation in isolation. • These features of the program in combination with its enormous scale suggest that the program has the potential to have a significant impact on current and future poverty in Mexico.
Phasing the Program in • The expansion of the program across localities and over time was determined by a planned strategy that involved the annual budget allocations and logistical complexities associated with the operation of the program in very small and remote rural communities. • As a consequence, the expansion of the program took place in eleven stages. • By phase eleven, the final phase of the program in early 2000, the program included nearly 2.6 million families. This constitutes around 40% of all rural families and one ninth of all families in Mexico.
Targeting • 3-Stage Targeting: • First-stage: Geographical Targeting. • Identification of the most marginal rural localities where the extreme poor are more likely to be found. • The identification of the marginal rural localities used a specially constructed “marginality index” based mainly on data from the national census.
Targeting 2. Second-stage: Selection of households within eligible localities. • PROGRESA used Proxy Means Tests. Using detailed socioeconomic data collected by the program from all the households in the eligible localities, households were classified as “poor” or “non-poor” using statistical techniques. 3. Finally, PROGRESA attempted to eliminate errors of exclusion and inclusion by a process of densification.
Targeting • As for the accuracy of PROGRESA’s targeting, it is an overall effective method of selecting households into the program. • The evaluation analysis shows that the accuracy of PROGRESA’s targeting, both in terms of selecting localities where poor households are more likely to be found and in terms of selecting poorest households within these localities, is good. • However, this accuracy fades when it comes to distinguishing between localities in the moderate level of marginality.
Evaluation • The evaluation of the program focuses on the identification of the impact of the program. The majority of the studies on evaluation of social programs focus on the question of whether the program changes the mean value of an outcome variable among participants compared to what they would have experienced if they had not participated. • The answer to this question is summarized by one parameter called the “Treatment on the treated” • E( | T = 1, X) = E(Y1 | T = 1, X) – E(Y0 | T = 1, X)
The term E(Y1 | T = 1, X) can be reliably estimated from the participants of the program. • What is missing is the mean counterfactual term E(Y0 | T = 1, X) that summarizes what participants would have experienced had they not participated in the program. • The empirical framework adopted by the PROGRESA administration for the purposes of evaluating the program’s impact offers an strategy to solving the evaluation problem. • Firstly, it was a quasi-experimental design with randomization of localities into treatment and control groups. • Secondly, data were collected from all households in both treated and control localities before and after the start the treatment.